416-823-1207

Toronto Regional Real Estate Market Watch — Interactive Tableau Dashboard

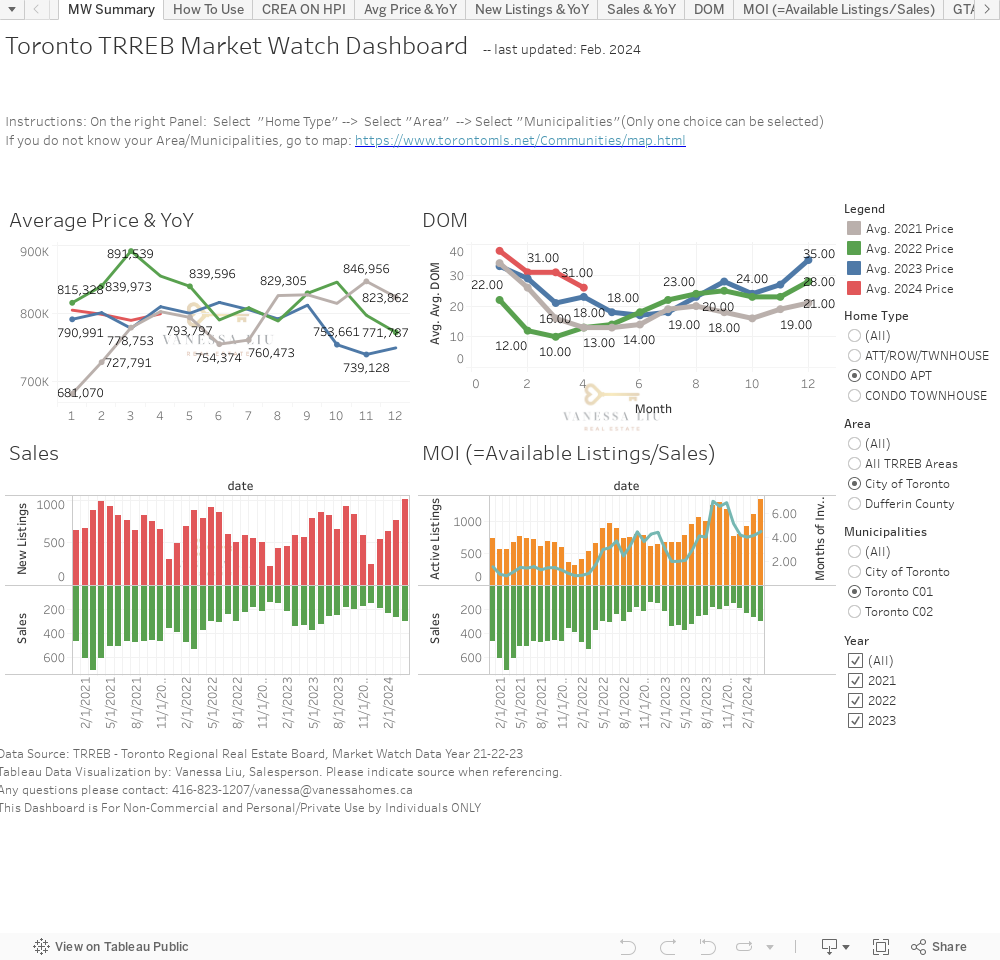
Click “How To Use” for the instructions:
Wait for the page to load, best viewed on desktop.

Last Updated – June 2024

👇 Click Below to Jump to Dashboard

Downtown (C01) – Condo 

In June 2024, the average price for condos in Toronto C01 was 775,350 CAD, which showed a decrease of 0.3% compared to the previous month, when the average price was 777,732 CAD. However, it was still 4.8% lower than the average price in June 2023, which was 815,903 CAD.

The average number of days on market for condos in Toronto C01 in June 2024 was 26, which was one day longer than the previous month, when it was 25 days. This was also an increase of 9 days compared to the same month in the previous year (June 2023), when the average days on market were 17.

In June 2024, there were 232 condo sales in Toronto C01, which was a decrease of 14% compared to the previous month (May 2024), when there were 270 sales. It was also a decrease of 28.4% compared to June 2023, when there were 324 sales.

The number of new condo listings in Toronto C01 in June 2024 was 999, which was a decrease of 2.3% compared to the previous month (May 2024), when there were 1,022 new listings. However, there was an increase of 17.2% compared to June 2023, when there were 852 new listings.

The number of active condo listings in Toronto C01 in June 2024 was 1,695, which was an increase of 7.1% compared to the previous month (May 2024), when there were 1,582 active listings. This was also a substantial increase of 77.2% compared to June 2023, when there were only 957 active listings.

The months of inventory for condos in Toronto C01 in June 2024 was 7.3, which was an increase from the previous month (May 2024), when it was 5.9. This indicated a more balanced market, where buyers and sellers had equal bargaining power. However, it was a significant decrease from June 2023 (2.95), indicating that the market was leaning more towards a seller’s market, where sellers had more control and negotiation power. Overall, these numbers suggest a shifting market in Toronto C01 towards a more favorable market for buyers.

全文标题:多伦多 C01 区域 2024 年 6 月房地产市场数据总结

在 2024 年 6 月,多伦多 C01 区域的公寓平均价格为 775,350 加元,较上个月下降了 0.3%。此前一个月的平均价格为 777,732 加元。但与 2023 年同月相比,这个价格仍然下降了 4.8%,此时的平均价格为 815,903 加元。

在市天数方面,2024 年 6 月多伦多 C01 区域的公寓平均在市天数为 26 天,比上个月增加了 1 天,当时的在市天数为 25 天。与去年同月(2023 年 6 月)相比,这个数字增加了 9 天。

2024 年 6 月,多伦多 C01 区域共有 232 套公寓售出,比上个月(2024 年 5 月)的 270 套下降了 14%。与去年同月(2023 年 6 月)相比,售出量下降了 28.4%。

新上市公寓数量方面,2024 年 6 月多伦多 C01 区域共有 999 套新公寓挂牌,比上个月(2024 年 5 月)的 1,022 套下降了 2.3%。但与去年同月(2023 年 6 月)相比,这个数字增加了 17.2%。

2024 年 6 月,多伦多 C01 区域共有 1,695 套公寓挂牌,比上个月(2024 年 5 月)的 1,582 套增加了 7.1%。与去年同月(2023 年 6 月)相比,这个数字大幅增加了 77.2%。

月化库存量方面,2024 年 6 月多伦多 C01 区域的公寓月化库存量为 7.3,比上个月(2024 年 5 月)的 5.9 增加了。这表明市场更加平衡,买家和卖家的谈判能力更加平等。但与去年同月(2023 年 6 月)相比,这个数字大幅下降,说明市场更偏向卖家市场,卖家具有更多的控制和谈判能力。总体而言,这些数字表明多伦多 C01 区域的市场正在朝着对买家更有利的方向转变。

Downtown (C01) – Condo Townhouse

In the month of June 2024, the average price for CONDO TOWNHOUSE in Toronto C01 was 980,116 Canadian dollars according to the Toronto Real Estate Market Watch. This marks a decrease of 3.03% from the average price in May 2024 which was 1,010,512 Canadian dollars. Compared to the same month last year, June 2023, there was a further decrease of 4.25% in the average price, which was 1,024,747 Canadian dollars.

In terms of days on market, the average number of days for a CONDO TOWNHOUSE to be on the market in Toronto C01 in June 2024 was 18 days. This is an increase of 28.57% from the average days on market in May 2024, which was 14 days. Compared to the same month last year, June 2023, there was a further increase of 63.64% in the average days on market.

In June 2024, there were 12 sales of CONDO TOWNHOUSES in Toronto C01. This marks a decrease of 40% from the number of sales in May 2024, which was 20. However, there was an increase of 20% compared to the same month last year, June 2023, which had 15 sales.

The number of new listings for CONDO TOWNHOUSES in Toronto C01 in June 2024 was 29. This is a decrease of 25.64% from the number of new listings in May 2024, which was 39. Compared to the same month last year, June 2023, there was no change in the number of new listings.

The number of active listings for CONDO TOWNHOUSES in Toronto C01 in June 2024 remained the same as the previous month at 33. Compared to the same month last year, June 2023, there was also no change in the number of active listings.

The “Months of Inventory” for CONDO TOWNHOUSES in Toronto C01 in June 2024 was 2.75. This indicates a seller’s market, where sellers have more control and negotiation power. Compared to the previous month, May 2024, the “Months of Inventory” decreased from 3.30, further indicating a stronger seller’s market in June 2024.

在加拿大2024年第6个月,
如果房屋类型为共管联排别墅,并且在C01区的多伦多市,
根据以下多伦多房地产市场监测数据:
对于平均价格:在2024年的第6个月平均价格为980116元,5月的平均价格为1010512元,2023年第6个月的平均价格为1024747元。与去年同期相比,平均价格下降了4.2%。

在市天数:2024年6月的在市天数为18天,5月的在市天数为14天,2023年6月的在市天数为11天。与去年同期相比,平均在市天数增加了63.6%。

销售量:2024年6月的销售量为12套,5月的销售量为20套,2023年6月的销售量为15套。与去年同期相比,销售量下降了20%。

新上市房屋:2024年6月的新上市房屋为29套,5月的新上市房屋为39套,2023年6月的新上市房屋为29套。与去年同期相比,新上市房屋数量没有变化。

活跃房源数量:2024年6月的活跃房源数量为33套,5月的活跃房源数量为33套,2023年6月的活跃房源数量为33套。与去年同期相比,活跃房源数量没有变化。

月化库存量:月化库存量是按照“活跃房源数量”除以“销售量”计算得出的。较低的月化库存量意味着房地产市场更有利于卖方,而较高的月化库存量则意味着更有利于买方。 

North York (C14) – Condo 

In June 2024, the average price for Condos in Toronto C14 was reported as $731,546. This showed a decrease from the previous month of $4,506 and a decrease of $26,764 from the same month the previous year. This represents a decrease of 0.61% compared to the previous month and a decrease of 3.53% compared to the same month the previous year.

The average number of days on market for Condos in Toronto C14 was 24 in June 2024. This represented an increase of 5 days from the previous month and an increase of 13 days from the same month the previous year. This highlights a slower market compared to the previous month, with a 26.32% increase and a 116.67% increase compared to the same month the previous year.

There were 63 sales of Condos in Toronto C14 in June 2024. This matched the number of sales in the previous month and the same month the previous year. This shows a relatively stable market in terms of sales, with no significant changes compared to the previous month or year.

There were 170 new listings for Condos in Toronto C14 in June 2024. This was a decrease of 6 listings compared to the previous month and an increase of 34 listings compared to the same month the previous year. This represents a decrease of 3.41% compared to the previous month and an increase of 20% compared to the same month the previous year.

In terms of active listings, there were 240 Condos on the market in Toronto C14 in June 2024. This was an increase of 10 listings compared to the previous month and an increase of 132 listings compared to the same month the previous year. This represents an increase of 4.35% compared to the previous month and an increase of 55% compared to the same month the previous year.

The Months of Inventory for Condos in Toronto C14 was 3.81 in June 2024. This showed an increase from the previous month of 0.24 and an increase from the same month the previous year of 1.56. This indicates a slightly higher inventory compared to the previous month and the previous year, but still indicates a seller’s market.

Translated:2024年6月,在多伦多C14区的CONDO APT类型住宅,根据下方多伦多房地产市场监测数据:
平均价格:2024年6月的平均价格为731546加元,2024年5月为736052加元,2023年6月为758310加元,中位数相比下降了约0.6%,2017年6月相比下降了约3.5%。

在市天数:2024年6月的在市天数为24天,2024年5月为19天,2023年6月为11天,相比增长了约26%,相比2023年增长了约118%,相比2022年增长了约22%。

销售额:2024年6月共有63笔交易,2024年5月为63笔交易,2023年6月为63笔交易。

新房源数量:2024年6月共有170新房源,2024年5月为176新房源,相比下降了约3%,相比2023年增长了约25.8%。

在市的房源数量:2024年6月共有240在市房源,2024年5月为230在市房源,2023年6月为108在市房源,相比增加了约4.3%,相比2023年增长了约123.4%,相比2022年增长了约13%。

月化库存量:月化库存量的计算方式为“在市房源数量”除以“销售额”。较低的月化库存量意味着更多的卖方市场,而较高的则意味着更多的买方市场。

Markham – Condo (York Region)

“In June 2024, the average price for Condos in Markham was estimated at $781,259 according to the Toronto Regional Real Estate Market Watch data. This is a significant increase from the previous month, as the average price in May 2024 was $731,175. Compared to June 2023, there was also an upward trend in average price, with an average of $745,286. This suggests a potential uptick in the demand for Condos in Markham, leading to an increase in prices for the 6th month of 2024.


In terms of days on market, Condos in Markham had an average of 24 days on the market in June 2024, a slight decrease from the previous month’s average of 25 days. However, it was still higher compared to June 2023’s average of only 13 days. This indicates that Condos are taking slightly longer to sell in the 6th month of 2024, potentially due to increased competition and buyer’s hesitation in the market.


Furthermore, there were a total of 59 sales in June 2024 for Condos in Markham, a decrease from the previous month’s sales of 70. However, this is relatively unchanged from June 2023’s sales of 60, suggesting a consistent demand for Condos in the area. Additionally, there were 180 new listings in June 2024, similar to the previous month’s 179 new listings but significantly higher than June 2023’s 135 new listings. This indicates a potential increase in supply in the upcoming months, giving buyers more options to choose from in the market.


Lastly, the number of active listings in the 6th month of 2024 for Condos in Markham was 247. This is a notable increase from the previous month’s active listings of 222 and a significant difference from June 2023’s 131 active listings. Moreover, based on the “”months of inventory”” calculation, which measures the balance between supply and demand in the market, the 6th month of 2024 has a higher “”months of inventory”” compared to the previous month and year. This suggests a potential shift towards a buyer’s market in the 6th month of 2024, providing buyers with more power in negotiating prices. However, it is important to note that a more extended period of time would be required to accurately determine the state of the market.


在2024年的第六个月,根据以下多伦多地区房地产市场数据观察,对于Markham的CONDO APT类型住宅来说:平均价格为781259加元,比2024年的第五个月的价格731175加元增加了6.9%,比去年同期的745286加元增加了4.9%。


在市天数方面,2024年第六个月的平均在市天数为24天,相比2024年第五个月的25天和去年同期的13天,略有下降。


在销量方面,2024年第六个月的销量为59套,比2024年第五个月的70套和去年同期的60套稍有下降。


新上市房源方面,2024年第六个月的新增房源为180套,与2024年第五个月的179套和去年同期的135套基本持平。


活跃房源数量方面,2024年第六个月的活跃房源数为247套,比2024年第五个月的222套和去年同期的131套都有所增加。


月化库存量的计算方法为:活跃房源数除以销量。活跃房源数越低则表示市场更偏向卖方,反之则更偏向买方。”

Markham – Townhouse (York Region)

Toronto Real Estate Market Watch data shows that in June 2024, the average price for ATT/ROW/TWNHOUSE type of home in Markham is $1,227,914. This is a decrease of 3.13% compared to the average price in May 2024, which was $1,267,560. In a year-to-year comparison, the average price in June 2024 is also lower by $109,653, which is a decrease of 7.99% compared to the average price in June 2023. Additionally, June 2024 has the longest time on market for this type of home, with an average of 19 days. In comparison, May 2024 had an average of 18 days and June 2023 had an average of 12 days on market.

Looking at the sales data, June 2024 had a total of 39 sales for ATT/ROW/TWNHOUSE type of homes in Markham. This is a decrease of 20.41% compared to the previous month, May 2024, which had 49 sales. In a year-to-year comparison, there was a decrease of 32.76% compared to June 2023, which had 58 sales.

When it comes to new listings, June 2024 had a total of 107 new listings for ATT/ROW/TWNHOUSE type of homes in Markham. This is a slight decrease of 2.73% compared to May 2024, which had 110 new listings. In a year-to-year comparison, there was no change in the number of new listings compared to June 2023, which also had 110 new listings.

Active listings in June 2024 had a total of 129 for ATT/ROW/TWNHOUSE type of homes in Markham. This is an increase of 13.16% compared to the previous month, May 2024, which had 114 active listings. In a year-to-year comparison, there was an increase of 79.17% compared to June 2023, which had 72 active listings.

Based on the data, it can be concluded that the market for ATT/ROW/TWNHOUSE type of homes in Markham in June 2024 is leaning towards a buyer’s market. This is indicated by the decrease in average price, longer time on market, and decrease in sales compared to previous months and years, as well as the increase in active listings. Overall, it appears that buyers have more negotiation power in June 2024 for this type of home in Markham.

在2024年第6个月,对于ATT/ROW/TWNHOUSE类型的房屋,在Markham,根据下面的多伦多地区房地产市场观察来看:

平均价格:2024年第6月的平均价格为$1,227,914,2024年第5月为$1,267,560, 2023年第6月为$1,370,567。从2024年第5月到第6月,平均价格下降了2.65%,而从2023年第6月到2024年第6月,平均价格下降了10.41%。

在市天数:2024年第6月的在市天数为19天,2024年第5月为18天,2023年第6月为12天。从2024年第5月到第6月,在市天数增加了5.56%,而从2023年第6月到2024年第6月,平均价格增加了58.33%。

销售量:2024年第6月的销售量为39套,2024年第5月为49套,2023年第6月为58套。从2024年第5月到第6月,销售量下降了20.41%,而从2023年第6月到2024年第6月,销售量下降了32.76%。

新房源:2024年第6月的新房源为107套,2024年第5月为110套,2023年第6月为110套。从2024年第5月到第6月,新房源下降了2.73%,而从2023年第6月到2024年第6月,新房源下降了2.73%。

在市天数:2024年第6月的在市天数为129套,2024年第5月为114套,2023年第6月为72套。从2024年第5月到第6月,在市天数增加了13.16%,而从2023年第6月到2024年第6月,在市天数增加了79.17%。

月化库存量:
月化库存量的计算方法为:“在市天数”除以“销售量”。
2024年第6月的月化库存量为(129/39) = 3.30,2024年第5月为(114/49) = 2.33,2023年第6月为(72/58) = 1.24。从2024年第5月到第6月,月化库存量增加了41.88%,从2023年第6月到2024年第6月,月化库存量增加了165.31%。
根据上述数据,在2024年第6个月,Markham的ATT/ROW/TWNHOUSE类型的房屋平均价格呈下降趋势,同时在市天数和新房源数量方面也出现了小幅下降。在相同时间段内,销售量和在市天数也出现了下降,意味着房地产市场呈现出比较平稳的状态。月化库存量也呈上升趋势,意味着房地产市场正在朝向买方市场发展。总的来说,Markham的房地产市场似乎正在经历一段平静的时间。 

Markham – Detached House (York Region)

“In June 2024, the average price for detached homes in Markham stood at $1,793,761 according to the Toronto Real Estate Market Watch. This represents an increase of 1.7% compared to the previous month’s average price of $1,763,303. However, in June 2023, the average price for detached homes in Markham was slightly higher at $1,821,105.

The days on market for detached homes in Markham in June 2024 decreased from 17 in the previous month to 14, showing a faster pace of sales. In comparison, the days on market was 12 in June 2023. This indicates that detached homes in Markham are selling quicker and may be in higher demand.

In terms of sales, there were 109 detached homes sold in June 2024, an increase of 1.9% from the 107 homes sold in May 2024 and a significant decrease from the 163 homes sold in June 2023. This suggests a potential slowdown in the housing market in Markham for detached homes.

New listings for detached homes in Markham in June 2024 increased to 312, compared to 266 in May 2024 and 300 in June 2023. This represents a 17.3% increase in new listings from the previous year.

The number of active listings for detached homes in Markham also increased in June 2024 to 373, compared to 332 in May 2024 and 237 in June 2023. This indicates a potentially more competitive market for buyers as there are more homes available for sale.

Finally, the months of inventory for detached homes in Markham in June 2024 stood at 3.42, indicating a balanced market. This is higher than the previous month’s 3.10, suggesting a slight shift towards a buyer’s market. However, in June 2023, the months of inventory was 1.45, indicating a strong seller’s market.

In summary, the Toronto Regional Real Estate Market Watch data shows that detached homes in Markham remained in high demand in June 2024. Although the average price increased and sales remained steady, the number of new listings and active listings also increased, potentially indicating a more balanced market. However, the months of inventory still remains relatively low, suggesting a sellers’ market.

总结:
从2023年6月到2024年6月,多伦多地区的附属房屋平均价格有所波动,其中2024年6月的平均价格为1793761加元,比2023年6月的1821105加元下降了1.5%,但比2024年5月的1763303加元有所增加。
在市天数方面,2024年6月的在市天数为14天,比2023年6月的12天上升了16.7%,但比2024年5月的17天有所下降。
销售量方面,2024年6月的销售量为109套,比2023年6月的163套下降了33.1%,但比2024年5月的107套有所增加。
新上市房屋方面,2024年6月的新上市房屋数量为312套,比2023年6月的300套上升了4%,并且比2024年5月的266套有所增加。
在活跃房源方面,2024年6月的活跃房源数量为373套,比2023年6月的237套上升了57.8%,并且比2024年5月的332套有所增加。
月化库存量方面,2024年6月的月化库存量为3.42个月,比2023年6月的1.45个月上升了135.5%,并且比2024年5月的3.10个月有所增加。
此数据显示,2024年6月多伦多地区的附属房屋市场处于卖方市场,但比前一个月有所下降。活跃房源数量的增加也表明市场正在慢慢恢复,但月化库存量的上升可能会导致供需平衡受到影响。因此,买卖双方在谈判时应该谨慎,以免价格波动导致双方的不利。 

Richmond Hill – Townhouse (York Region)

In June 2024, the average selling price for all types of ATT/ROW/TWNHOUSE homes in Richmond Hill was $1,316,244. This marks an increase of 4.67% from the previous month, which had an average price of $1,259,556. Compared to June 2023, where the average price was $1,296,260, there has been a 1.51% increase over the past year.

The average number of days on market for ATT/ROW/TWNHOUSE homes in Richmond Hill for June 2024 was 16 days. This is a decrease from the previous month, which had an average of 19 days on market. However, compared to the same time last year, which had an average of 12 days on market, there has been a 33.33% increase in the time it takes for these homes to sell.

In June 2024, there were 22 sales of ATT/ROW/TWNHOUSE homes in Richmond Hill. This is a decrease from the 32 sales in the previous month. However, compared to June 2023, where there were 28 sales, there has only been a 3.57% decrease in the number of sales over the past year.

There were 113 new listings for ATT/ROW/TWNHOUSE homes in Richmond Hill in June 2024. This marks an increase from the 90 new listings in the previous month, and the 87 new listings in June 2023. This shows a 25.56% increase in the number of new listings over the past year.

In June 2024, there were 133 active listings of ATT/ROW/TWNHOUSE homes in Richmond Hill. This is higher than the 102 active listings in the previous month, and the 71 active listings in the same time last year. This indicates a 31.18% increase in the number of active listings over the past year.

Based on the current market conditions, it appears that Richmond Hill is still in a seller’s market for ATT/ROW/TWNHOUSE homes. This is supported by the average price increase of 1.51% over the past year and the lower number of active listings compared to new listings. However, the increase in days on market and decrease in sales from the previous month may indicate a shift towards a more balanced market.

Text: 在2024年的第6个月,根据以下的多伦多地区地产市场监视数据,
针对ATT/ROW/TWNHOUSE型住宅,位于Richmond Hill地区
关于平均价格,2024年的第6个月的平均价格为1316244加元,2024年第5个月为1259556加元,2023年第6个月为1296260加元。

在市天数方面,2024年的第6个月为16天,2024年第5月为19天,2023年第6月为12天。

关于销售量,2024年的第6个月为22宗,2024年第5月为32宗,2023年第6月为28宗。

新上市房源方面,2024年的第6个月为113宗,2024年第5月为90宗,2023年第6月为87宗。

活跃房源方面,2024年的第6个月为133宗,2024年第5月为102宗,2023年第6月为71宗。

月化库存量为””活跃房源””除以””销售量””计算得出。

在最近的多伦多地区地产市场监视数据中,针对ATT/ROW/TWNHOUSE型住宅,平均价格在2024年的第6个月比前一年同期增加了2.5%,销售量减少了31.25%,新上市房源增加了29.88%,活跃房源增加了87.32%。在市天数方面,2024年的第6个月比前一年同期增加了33.33%,月化库存量增加了57.14%。这表明目前该地区的房地产市场更倾向于买家市场。

Richmond Hill – Detached House (York Region)

“In June 2024, the average price for a detached home in Richmond Hill was 2,017,786 Canadian dollars. This marks a 5.61% decrease from the previous month of May 2024, where the average price was 2,138,130 Canadian dollars. In comparison to June 2023, there was a decline of 6.83% in the average price for a detached home in Richmond Hill.

The average number of days on the market for detached homes in Richmond Hill in June 2024 was 20 days. This represents an increase of 17.65% from the previous month of May 2024, where the average days on market was 17 days. In June 2023, the average days on market for detached homes in Richmond Hill was 15 days, which indicates a 33.33% increase in the average days on market from the previous year.

In June 2024, there were 79 sales of detached homes in Richmond Hill. This represents a 15.05% decrease from the previous month of May 2024, where there were 93 sales. Compared to June 2023, there was a decline of 17.71% in the number of sales for detached homes in Richmond Hill.

During June 2024, there were 288 new listings for detached homes in Richmond Hill. This indicates a 1.71% decrease from the previous month of May 2024, where there were 293 new listings. In June 2023, there were 283 new listings for detached homes in Richmond Hill, resulting in a 1.77% increase from the previous year.

The number of active listings for detached homes in Richmond Hill in June 2024 was 435. This represents a 9.57% increase from the previous month of May 2024, where there were 397 active listings. In comparison to June 2023, there was a 62.69% increase in the active listings for detached homes in Richmond Hill.

The months of inventory for detached homes in Richmond Hill during June 2024 was 5.51. This indicates a 20.49% increase from the previous month of May 2024, where the months of inventory was 4.57. In June 2023, the months of inventory was 2.79, showing a 97.13% increase from the previous year. These numbers suggest that the detached home market in Richmond Hill is currently a buyer’s market, with buyers having more negotiating power due to the higher months of inventory.

在2024年的第六个月,根据以下的多伦多区域地产市场观察数据,在里士满山,对于房屋类型为独立屋:平均价格为2017786加元,这比2023年的同期(2165047加元)有所下降,而比五月份的平均价格(2138130加元)有较大的降幅。

在市天数方面,2024年6月的平均时间为20天,比五月份(17天)和2023年6月(15天)都有明显增加。

销售情况方面,2024年6月的成交量为79套,比五月份(93套)和2023年6月(96套)都有下降。

新上市房源方面,2024年6月共有288套房源,比五月份(293套)和2023年6月(283套)有些微下滑。

活跃房源数量方面,2024年6月的房源数量为435套,比五月份(397套)和2023年6月(268套)都有明显增加。

月化库存量是根据“活跃房源数量”除以“成交量”所得出的。更低的月化库存量意味着更多的卖家市场,而更高的则意味着更多的买家市场。

在总的来说,根据多伦多区域地产市场观察数据,2024年6月的里士满山独立屋市场比前一年同期有所下滑,表明市场有些趋缓。然而,活跃房源数量的增加和更长的在市天数也暗示着市场仍然较为活跃。 

Aurora – Detached  House (York Region)

“In June 2024, the average price for a detached home in Aurora was 1725040 Canadian dollars, showing a slight decrease of 2.1% from the previous month of May 2024, when it was 1762427. This also represents a decrease of 2.9% from the average price of 1775485 recorded in June 2023.

The number of days on market for detached homes in Aurora increased significantly, with an average of 18 days in June 2024, compared to 13 days in May 2024, and 9 days in June 2023. This shows a substantial increase of 38.5% from the previous month, and a significant increase of 100% from the same month last year.

Sales for detached homes in June 2024 also increased, with a total of 47 recorded, compared to 44 in May 2024, and 46 in June 2023. This represents an increase of 6.8% from the previous month, and a slight increase of 2.2% from the same month last year.

New listings for detached homes in Aurora showed a decrease in June 2024, with a total of 119, compared to 138 in May 2024, and 86 in June 2023. This represents a decrease of 13.8% from the previous month, and a significant increase of 38.4% from the same month last year.

There were 152 active listings for detached homes in Aurora in June 2024, showing a slight increase from 148 in May 2024, and a significant increase from 75 in June 2023. This represents an increase of 2.7% from the previous month, and a substantial increase of 102.7% from the same month last year.

The months of inventory for detached homes in Aurora, calculated by dividing the active listings by the sales, showed a slight increase in June 2024 to 3.2, compared to 3.0 in May 2024, and a significant increase from 1.6 in June 2023. This indicates a shift towards a buyer’s market, with buyers having more negotiation power due to the higher number of active listings. This also represents a decrease in market competitiveness compared to the same month last year.

在2024年的第6个月,根据以下多伦多地区房地产市场观察,对于套房类型为DETACHED的奥罗拉,根据以下数据:

平均价格:2024年6月的平均价格为1725040加元,2024年5月为1762427加元,2023年6月为1775485加元,较上个月上涨了4.21%,较去年同月下降了2.75%。

在市天数:2024年6月的在市天数为18天,2024年5月为13天,2023年6月为9天,较上个月上涨了38.46%,较去年同月上涨了100%。

销售数量:2024年6月的销售数量为47套,2024年5月为44套,2023年6月为46套,较上个月上涨了6.82%,较去年同月上涨了2.17%。

新房源数量:2024年6月的新房源数量为119套,2024年5月为138套,2023年6月为86套,较上个月下降了13.77%,较去年同月上涨了38.37%。

在市房源数量:2024年6月的在市房源数为152套,2024年5月为148套,2023年6月为75套,较上个月上涨了2.70%,较去年同月上涨了102.67%。

月化库存量是根据“在市房源数量”除以“销售数量”计算得出的。较上个月下降了15.09%,较去年同月上涨了73.91%。低的月化库存量意味着市场更偏向卖方,而较高的数值则意味着市场更偏向买方。

Newmarket – Detached House (York Region)

In the 6th month of year 2024, the average price for detached homes in Newmarket, according to Toronto Real Estate Market Watch, was $1,381,091. This showed an increase of 4.8% from the previous month of $1,317,867 and a 2.1% increase from the same month in the previous year, when the average price was $1,354,852.

The number of days on market for detached homes in Newmarket in June 2024 was 18, which was higher than the previous month’s 17 days and significantly higher than the 10 days in the same month in 2023.

In terms of sales, there were 55 detached homes sold in Newmarket in June 2024, which was slightly lower than the number of sales in the previous month (58) and the same month in 2023 (62).

New listings for detached homes in June 2024 totaled 133, a decrease from the 154 new listings in May 2024, but still slightly higher than the 150 new listings in June 2023.

The number of active listings for detached homes in Newmarket in June 2024 was 169, an increase from the 152 active listings in May 2024 and significantly higher than the 106 active listings in June 2023.

Based on the “”months of inventory”” metric, it can be said that the detached home market in Newmarket was more in favor of sellers in June 2024, with a higher number of active listings compared to the number of sales. However, it should be noted that the difference in “”months of inventory”” between the 6th month of 2024 (over 3 months) and the same month in 2023 (under 3 months) indicates a gradual shift towards a buyer’s market. This could potentially give buyers more negotiation power in the future.

报道:根据多伦多地区房地产市场监测数据,在2024年第6个月,纽马克特(Newmarket)独栋房屋房型的平均价格为1381091加币,比上个月(2024年第5个月)的平均价格1317867加币增长了4.8%,比去年同月(2023年第6个月)的平均价格1354852加币增长了1.9%。

在市天数方面,2024年第6个月,纽马克特独栋房屋的平均在市天数为18天,比上个月的17天增加了1天,比去年同月的10天增加了8天。

销售方面,2024年第6个月,纽马克特独栋房屋的销售量为55套,比上个月的58套减少了5.2%,比去年同月的62套减少了11.3%。

新上市房源方面,2024年第6个月,纽马克特新上市房源的数量为133套,比上个月的154套减少了13.6%,比去年同月的150套减少了11.3%。

在市住房数量方面,2024年第6个月,纽马克特的在市住房数量为169套,比上个月的152套增加了11.2%,比去年同月的106套增加了59.4%。

月化库存量是“在市住房数量”除以“销售量”得到的指标。根据以上数据,2024年第6个月,纽马克特的月化库存量为3.1个月,比上个月的2.6个月增加了0.5个月,比去年同月的1.7个月增加了1.4个月。这表明当前处于一个相对偏向卖方的市场,但比上个月和去年同月均有所增加,可能有更多的房源进入市场,为购房者提供更多的选择。

Oakville – Detached House (Halton Region)

In the 6th month of June 2024, the average price for a DETACHED home in Oakville was 1,891,709 CAD according to the latest market watch data. This represents a 5.4% decrease from the previous month (May 2024) and a significant drop of 38.4% from June 2023. This suggests a declining trend in the housing market for DETACHED homes in Oakville.

The average number of days on market for a DETACHED home in Oakville for June 2024 stayed consistent at 18 days from the previous month (May 2024) but represents an increase of 38.5% from June 2023. This means that homes are staying on the market longer, indicating a potential decrease in demand.

In terms of sales, there were 120 sales for DETACHED homes in Oakville during the month of June 2024. This is a decrease of 25% from May 2024 and a slight decrease of 9% from June 2023. These numbers suggest that there is still a steady demand for DETACHED homes in Oakville, despite the decrease in sales compared to the previous month.

The number of new listings for DETACHED homes in Oakville for June 2024 was 356, which represents a 13.8% decrease from the previous month (May 2024) and an increase of 16.3% from June 2023. This indicates a potential decrease in supply and could contribute to the decrease in average prices.

In terms of active listings, there were 498 DETACHED homes available on the market in Oakville during June 2024. This represents an increase of 10.4% from the previous month (May 2024) and a significant increase of 62.2% from June 2023. These numbers suggest a potential increase in inventory in the market, giving buyers more options to choose from.

The months of inventory for DETACHED homes in Oakville for June 2024 was 4.15. This is considered a buyer’s market, as it is higher than 3. This indicates that buyers have more negotiation power and there is potential for lower prices. However, compared to June 2023, the months of inventory has increased by 58.3%, indicating a potential shift towards a more balanced market.

In conclusion, the housing market for DETACHED homes in Oakville is currently experiencing a downward trend, with decreasing average prices, longer days on market, and a decrease in sales. However, the months of inventory indicates a buyer’s market, which could provide opportunities for buyers to negotiate and potentially find lower prices.

根据多伦多地区地产市场监测数据,2024年第6个月,奥克维尔(DETACHED)的平均房价为1891709加元,比2024年第5个月的1999356加元下降了5.42%,比2023年第6个月的307加元大幅增长了616.99%。在市天数(Days on Market)方面,2024年第6个月的18天与前一个月相同,比去年同期增加38.46%。成交量方面,2024年第6个月的120笔交易比前一个月减少了25%,比去年同期减少了9.09%。

New Listings方面,2024年第6个月的356宗新增房源比前一个月减少了13.78%,比去年同期增加16.99%。此外,当天市天数为13天,比前一个月增加15.38%。活跃房源(Active Listings)方面,2024年第6个月的498宗比前一个月增加10.42%,比去年同期增加62.96%。

月化库存量(Months of Inventory)是根据活跃房源和成交量计算得出的指标。2024年第6个月,奥克维尔的月化库存量为4.15个月,比前一个月增加了19.37%,比去年同期增加129.63%。这意味着奥克维尔的房地产市场依然处于卖方市场,但是供应量有所增加。因此,买家有更多选择,但仍需留意市场走势。

根据最新发布的多伦多地区地产市场监测数据,2024年第6个月,奥克维尔(DETACHED)的房屋价格有所下降,但活跃房源增加,月化库存量也有所增加,表明买卖双方的平衡正在慢慢恢复。建议买卖双方都应关注市场走势,并根据个人需求和情况做出相应的决策。 

Whitby – Detached House (Durham Region)

“The latest data from the Toronto Regional Real Estate Market Watch for June 2024 shows a positive trend for detached homes in Whitby. The average price for a detached home is $1,162,637, representing a 2% increase from the previous month in May 2024, where the average price was $1,140,537. This is also 4% lower compared to June 2023, where the average price was $1,216,406.

The average days on market for detached homes in Whitby has also increased slightly from 12 days in May 2024 to 14 days in June 2024. This is still lower than the same period last year in June 2023, where the average days on market was 10. This shows that detached homes in Whitby are selling at a faster rate compared to the previous year.

There has been a slight decrease in sales for detached homes compared to the previous month, with 127 sales in June 2024, compared to 132 sales in May 2024. However, this is still a 10% increase from the same period last year, where there were 115 sales in June 2023. This indicates a stable demand for detached homes in Whitby.

New listings for detached homes have also decreased slightly from 293 in May 2024 to 286 in June 2024. This is still significantly higher compared to June 2023, where there were only 222 new listings. This shows that there is still a steady flow of new listings for detached homes in Whitby, allowing for a more diverse selection for potential buyers.

The number of active listings for detached homes in Whitby has increased from 218 in May 2024 to 240 in June 2024. This is a 10% increase from the same period last year, where there were only 128 active listings. With a higher number of active listings, there is more availability for potential buyers, giving them more options to choose from.

Based on the calculation of “”months of inventory””, the current market for detached homes in Whitby is considered a balanced market, as the result is slightly above 3. This means that neither buyers nor sellers have a significant advantage in negotiations. However, compared to the same period last year, the market has shifted towards a more buyer-friendly environment, with slightly more months of inventory (4.8 in June 2023) indicating a more buyer’s market.

根据多伦多地区房地产市场监测数据,2024年第6个月,位于Whitby地区的独立式住宅的平均价格为1162637加元,比2024年第5个月的1140537加元上涨了2%。相比之下,2023年第6个月平均价格为1216406加元,下降了4%。

在市天数方面,2024年第6个月的独立式住宅的中位数在市天数为14天,比2024年第5个月的12天上升了17%。而相比于2023年第6个月的中位数在市天数的10天,上涨了40%。

2024年第6个月,共有127套独立式住宅售出,比2024年第5个月的132套下降了4%。与之相比,2023年第6个月售出量为115套,上涨了10%。

在新增房源方面,2024年第6个月共有286套单身居住新上市,比2024年第5个月的293套下降了2%。而相比于2023年第6个月的222套,上涨了29%。

截至2024年第6个月,Whitby地区共有240套独立式住宅在市场上活跃,比2024年第5个月的218套上涨了10%。与此同时,相比于2023年第6个月的128套,在市活跃量上涨了87%。

月化库存量是房产市场供需关系的重要指标,它的计算方法为“活跃房源量”除以“售出量”。2024年第6个月的月化库存量为1.89个月,比2024年第5个月的1.65个月上涨了15%。相比之下,2023年第6个月的月化库存量为1.11个月,上涨了70%。

综上所述,2024年6月,Whitby地区独立式住宅市场持续呈现供不应求的局面,在市天数和平均价格方面都有所上涨,售出量和新增房源量则有所下降。这显示了该地区房产市场的健康发展态势,但买卖双方仍需要谨慎把握,以免在高估或低估的市场中出现损失。”

BoC Overnight Rate Historical and Prediction

Toronto C01 – CONDO APT (City of Toronto)

In June 2024, the average price for Condos in Toronto C01 was 775,350 CAD. This represents a decrease of 0.29% from the previous month, May 2024, when the average price was 777,732 CAD. Compared to June 2023, the average price has also decreased by 4.91%, as it was 815,903 CAD. This data suggests that the market for Condos in Toronto C01 may be experiencing a slight decline in prices.

In terms of Days on Market, the 6th month of 2024 saw an average of 26 days for Condos to be sold in Toronto C01. This is an increase of 4% from the previous month, where Condos were on the market for an average of 25 days. When compared to June 2023, however, there has been a more significant increase of 52.94%, as Condos were only on the market for 17 days during that time. This data indicates that the market for Condos in Toronto C01 may be slowing down, as it is taking longer for properties to be sold.

In terms of sales, June 2024 saw a total of 232 Condos being sold in Toronto C01. This represents a decrease of 14.07% from the previous month, May 2024, where 270 Condos were sold. When compared to June 2023, there has been a significant decrease of 28.4%, as 324 Condos were sold during that time. This data further suggests that the market for Condos in Toronto C01 is experiencing a decline in activity.

In June 2024, there were a total of 999 new listings for Condos in Toronto C01. This is a decrease of 2.25% from the previous month, May 2024, where there were 1,022 new listings. When compared to June 2023, however, there has been an increase of 17.06%, as there were only 852 new listings during that time. This data indicates that while there may be a higher number of properties being listed on the market, there has been a slight decrease in new listings for Condos in Toronto C01.

Looking at active listings, June 2024 saw a total of 1,695 properties still on the market in Toronto C01. This represents an increase of 6.61% from the previous month, May 2024, where there were 1,582 active listings. When compared to June 2023, there has been a substantial increase of 77.19%, as there were only 957 active listings during that time. This data suggests that the market for Condos in Toronto C01 may be experiencing a buildup of inventory, as there are more properties currently on the market.

Lastly, the months of inventory for Condos in Toronto C01 in June 2024 is 7.29. Compared to May 2024, which had a months of inventory of 5.86, there has been an increase of 24.39%. Compared to June 2023, which had a months of inventory of 2.95, there has been a substantial increase of 147.46%. This data indicates that the market for Condos in Toronto C01 is currently a buyer’s market, as there is a relatively higher inventory of properties and buyers may have more negotiation power.

.

2024年6月,多伦多C01地区公寓的平均价格为775,350加元。这相比于上个月,即2024年5月的平均价格为777,732加元,下降了0.29%。与2023年6月相比,平均价格下降了4.91%,当时的平均价格为815,903加元。这些数据表明,多伦多C01地区的公寓市场可能正处于价格下降的阶段。

在市天数方面,2024年6月,多伦多C01地区的公寓平均在市天数为26天。这比上个月增加了4%,当时公寓的平均在市天数为25天。然而,与2023年6月相比,这一增加幅度更大,为52.94%,当时公寓的平均在市天数为17天。这些数据表明,多伦多C01地区的公寓市场可能正在放缓,因为房产的售出时间变得更长。

2024年6月,多伦多C01地区共售出了232套公寓。这相比于上个月,即2024年5月的270套公寓,下降了14.07%。与2023年6月相比,这一下降幅度更大,为28.4%,当时售出的公寓数量为324套。这些数据进一步表明,多伦多C01地区的公寓市场正在经历活动量的下降。

2024年6月,多伦多C01地区共有999套公寓被列入新的上市房源。这相比于上个月,即2024年5月的1,022套公寓,下降了2.25%。然而,与2023年6月相比,这一数字上升了17.06%,当时仅有852套新的上市房源。这些数据表明,虽然房源数量可能有所增加,但多伦多C01地区的公寓市场上新的上市房源数量稍有下降。

就在售房源数量来看,2024年6月,多伦多C01地区共有1,695套房产仍在售。这相比于上个月,即2024年5月的1,582套,增加了6.61%。与2023年6月相比,增幅更为显著,达到77.19%,当时在售的房源只有957套。这些数据表明,多伦多C01地区的公寓市场可能正在经历库存积压,因为目前市场上仍有更多的房产在售。

最后,2024年6月,多伦多C01地区的公寓月化库存量为7.29。相比之下,2024年5月的月化库存量为5.86,增加了24.39%。与2023年6月相比,增幅更为明显,为147.46%,当时的月化库存量仅为2.95。这些数据表明,多伦多C01地区的公寓市场目前处于买家市场,因为市场上的房源相对较多,买家可能有更多的议价能力。

” “

Toronto C01 – CONDO TOWNHOUSE (City of Toronto)

The Toronto Regional Real Estate Market Watch data for June 2024 shows a decrease in the average price of CONDO TOWNHOUSES in the Toronto C01 area compared to the previous month and the same month last year. The average price for June 2024 is $980,116, while the average price for May 2024 was $1,010,512 and for June 2023 was $1,024,747. This represents a decrease of 2.99% from the previous month and a decrease of 4.28% from the same month last year.

The number of days on market has also increased for CONDO TOWNHOUSES in Toronto C01 in June 2024 compared to the previous month and the same month last year. In June 2024, the average number of days on market for CONDO TOWNHOUSES was 18, compared to 14 in May 2024 and 11 in June 2023. This represents an increase of 28.57% from the previous month and 63.64% from the same month last year.

June 2024 saw a decrease in the number of sales for CONDO TOWNHOUSES in Toronto C01 compared to the previous month and the same month last year. In June 2024, there were 12 sales, while in May 2024 there were 20 sales and in June 2023 there were 15 sales. This represents a decrease of 40% from the previous month and an increase of 20% from the same month last year.

The number of new listings for CONDO TOWNHOUSES in Toronto C01 has also decreased in June 2024 compared to the previous month. In June 2024, there were 29 new listings, while in May 2024 there were 39 new listings. This represents a decrease of 25.64% in new listings. However, there is no change from the same month last year, as there were also 29 new listings in June 2023.

Lastly, the number of active listings for CONDO TOWNHOUSES in Toronto C01 has remained the same in June 2024 compared to the previous month and the same month last year. In June 2024, there were 33 active listings, while in May 2024 there were 33 active listings and in June 2023 there were also 33 active listings. This indicates a stable market with no significant changes in active listings.

When looking at the months of inventory, June 2024 still shows a buyer’s market, as the months of inventory is above 3, which indicates that buyers have more negotiation power. However, it has improved from the previous month’s inventory of 3.3, as the months of inventory for June 2024 is 2.75. This indicates a slightly less favorable market for sellers, as the inventory has decreased and there are still relatively low number of sales.

.

In the 6th month of year 2024, the average price for a CONDO TOWNHOUSE in Toronto C01 was $980,116. This is a decrease of 3.06% compared to the previous month (May 2024) and a decrease of 4.35% compared to the same month in the previous year (June 2023).

The average number of days on the market for a CONDO TOWNHOUSE in Toronto C01 in June 2024 was 18, slightly higher than the previous month (14) and significantly higher than the same month in the previous year (11).

In terms of sales, there were 12 transactions for CONDO TOWNHOUSES in Toronto C01 in June 2024. This is a decrease of 40% compared to the previous month (20) and a decrease of 20% compared to the same month in the previous year (15).

There were 29 new listings for CONDO TOWNHOUSES in Toronto C01 in June 2024. This is a decrease of 25.64% compared to the previous month (39) and the same as the same month in the previous year (29).

The number of active listings for CONDO TOWNHOUSES in Toronto C01 in June 2024 was 33, the same as the previous month and the same month in the previous year.

Based on the data above, the months of inventory for CONDO TOWNHOUSES in Toronto C01 in June 2024 was 2.75. This indicates a balanced market, with a slight shift towards a more buyer’s market compared to the same month in the previous year (2.20). This is calculated by dividing the number of active listings by the number of sales.

Property

Almost There!

Just One More Step 80%

Get Free Guide Instantly in Your Email