

2023 – A Year of TWO HALVES?!
Open: video of JASON Mercer, a year of two halves, a year of two halves?!
I’ve been talking to a lot of homeowners and buyers lately, and everybody, everybody wants to know what is happening in the real estate market in 2023.
The Toronto Regional Real Estate Board (TRREB) just released the highly-anticipated 2023 Market Outlook & 2022 Year Review Report
As we see in the beginning of the video,
TRREB’s Chief Market Analyst Jason Mercer, summarized that the year of 2023 is going to be a year of Two Halves.
What does it mean two halves? And when is the turning point?
In today’s video I’ll explain all these questions.
I will also include a most recent updated Interactive Market Watch Dashboard, which you can download instantly in your email, so you have access to the most recent real estate market report for each property types and areas.
[To get Your Property Data Report/Dashboard for Your Property Type and Area like the one below, just Click Here]
Throughout this year, I will also release monthly videos on the latest real estate news, and market trends. So make sure you subscribe to this channel, hit the bell notification, so you don’t miss critical dates and latest news.
Ok let’s start today’s video!
A Year of Two Halves – 2023 Market Outlook
Jason Mercer, TRREB’s Chief Market Analyst, predicts the year of 2023 to be a year of two halves.
He predicts that the first half of the year will be similar to the handoff from 2022, where we’ve seen a flatlining in terms of sales, and of the average selling price, which suggests we’ve reached a bit of a bottom in the real estate market.
And as would-be homebuyers who have moved to the sidelines start to realize this, we’ll start to see more of them moving back into the marketplace in the second half of the year.
As we move through the second half of the year. We are also going to see a record level of population growth due to immigration that will lead to tighter market conditions”
And all of that will start to add upward pressure on Average Selling Prices in the second half of 2023.
So, That is the Toronto Real Estate Board’s prediction of the real estate market in 2023. I think so far it’s been pretty accurate. What is your prediction? Leave your comments below.
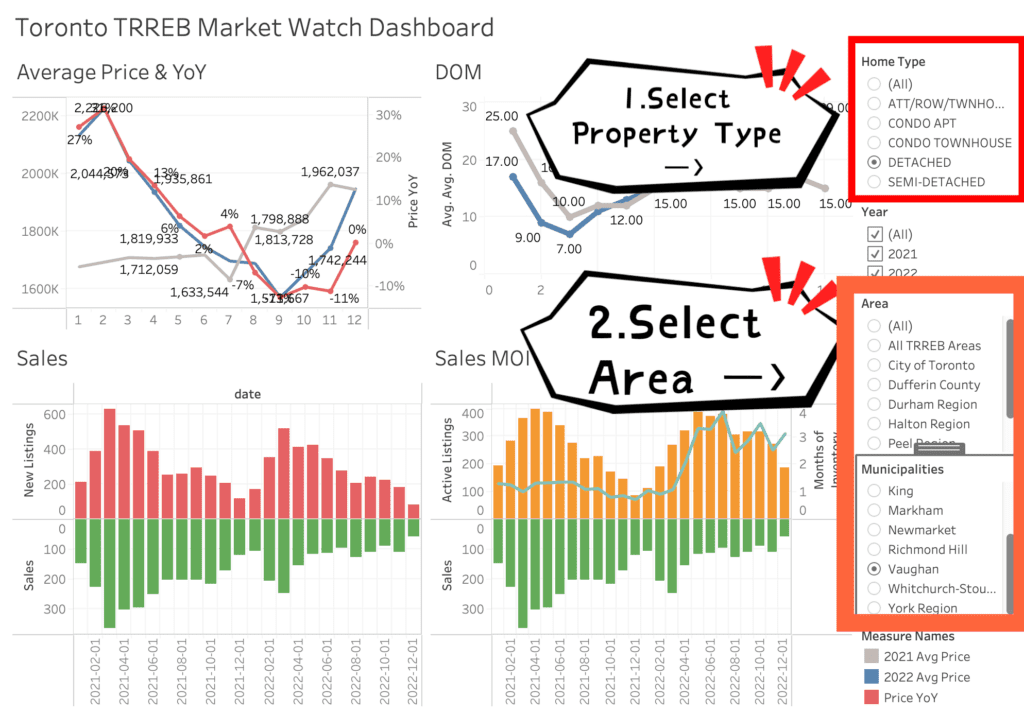
Latest Market Watch Report for March
I’ve just updated the new Market Watch data for March to the Tableau Interactive Dashboard.
You can download this dashboard instantly in your email by clicking the the link on the screen or in the video description.
[To get Your Property Data Report/Dashboard for Your Property Type and Area like the one below, just Click Here]
I’m really curious to see how the data performed during February and March for each market segment.
The line charts on the top row showed trends of average price and days on market, the blue line shows the most recent Jan to March Data in 2023.
I want everybody to really pay attention to the Days On Market, or DOM. which is basically a measure of how many days it takes for a property to be sold.
The bar chart on the bottom left showed the number of New listings VS number of Sales.
The last chart is the most interesting one, which shows the number of Active Listings, number of Sales, and the line represents Months of Inventory or MOI.


Now, what is months of inventory or MOI?
A lot of us learned from Econ 101 that:
Price is largely affected by Supply and demand
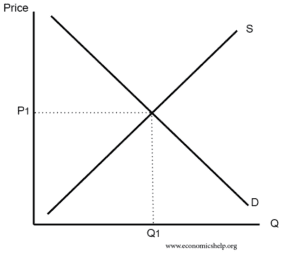
When we have much more supply than demand, the price will go down, and vice versa.
Basically, the months of inventory or MOI, which is calculated as the number of active listings divided by number of sales, is a pretty good representation of the supply vs demand ratio.
For example, when we look at Detached Homes in York Region, Months of inventory was very low during 2021, meaning w e have much lower inventory of Active Listings than Sales, aka, supply vs demand. So we can see the price during 2021 was having an upward trend. On the other hand, we have high months of inventory during 2022, resulting in the price going down.
Now, what do we have now in 2023?
First let’s take a look at condos:
For downtown C01 area, Average Price remained pretty stable in the beginning of 2023, and pretty similar to the end of last year. What I want everyone to look at is Days on Market and Months of Inventory. The Days on Market dropped significantly during Feb and Mar, which means it takes shorter time for a property to sell now. However, this can be seasonal, because we can see beginning of 2021 and 2022 the Days on Market also dropped this time of year. Now if we look at Months of Inventory, which is represented by the blue line in the last chart, also dropped significantly from 4 to 2. In Toronto Market, a month of inventory of around 2.5 means we have a balanced market. If we keep having low Months of Inventory below 2.5, that might mean we are heading towards a seller’s market.
Next: How about detached houses?
For Markham, Richmondhill, Vaughan, and Aurora in York Region, we see the average price all went up a little bit in March, especially for Markham, the average price went up from 1.65 mil to 1.8 from Jan to March. We also see Days on Market and and Months of inventory dropped significantly. An average detached house only takes about 15 days to sell, and days on market heading towards one, all indicate we might be entering a very strong seller’s market. As a professional real estate agent, I am active in the market every single day. I also see bidding wars more and more often these days. We don’t have enough listings, but buyers still want to buy, because the price seems already bottomed up, and interest rate is probably not going to get even higher for the rest of the year,
Now, what about other areas and other property types such as townhouses?
We all know different areas and property types can perform pretty differently. How long does it take for property in your area to sell? What is the supply and demand ratio in your area?
Are you curious to see how your biggest asset is performing during 2023?
Just click the link on the screen or in the video description, to download your market report instantly in your email, so you can stay current of the market!
[To get Your Property Data Report/Dashboard for Your Property Type and Area like the one below, just Click Here]
Ending
And do you still remember that it’s gonna be a year of two halves?
It’s already April. Has the second half already started?
I think for some areas we already see the market bouncing back. It will also depend on the ongoing dynamic between buyers and sellers, and many other factors such as interest rate and government policies.
Every month on this channel, I’ll update you on the latest real estate market stats and news.
Make sure you subscribe to my channel, hit the bell notification.
Don’t forget to download my Tableau Interactive Market Watch Dashboard.
[To get Your Property Data Report/Dashboard for Your Property Type and Area like the one below, just Click Here]
So make sure you subscribe to this channel, hit the bell notification, and I’ll see you in the next video/blog!