

Toronto C01 – CONDO APT (City of Toronto)
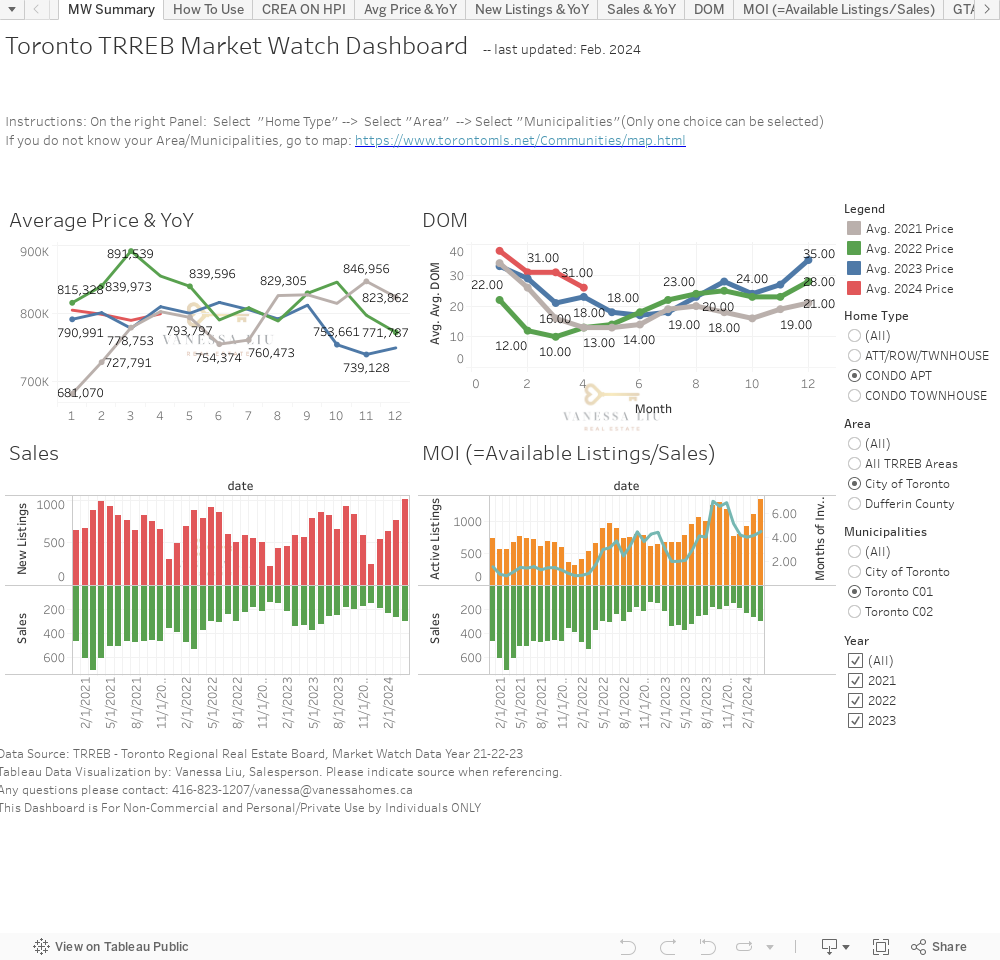
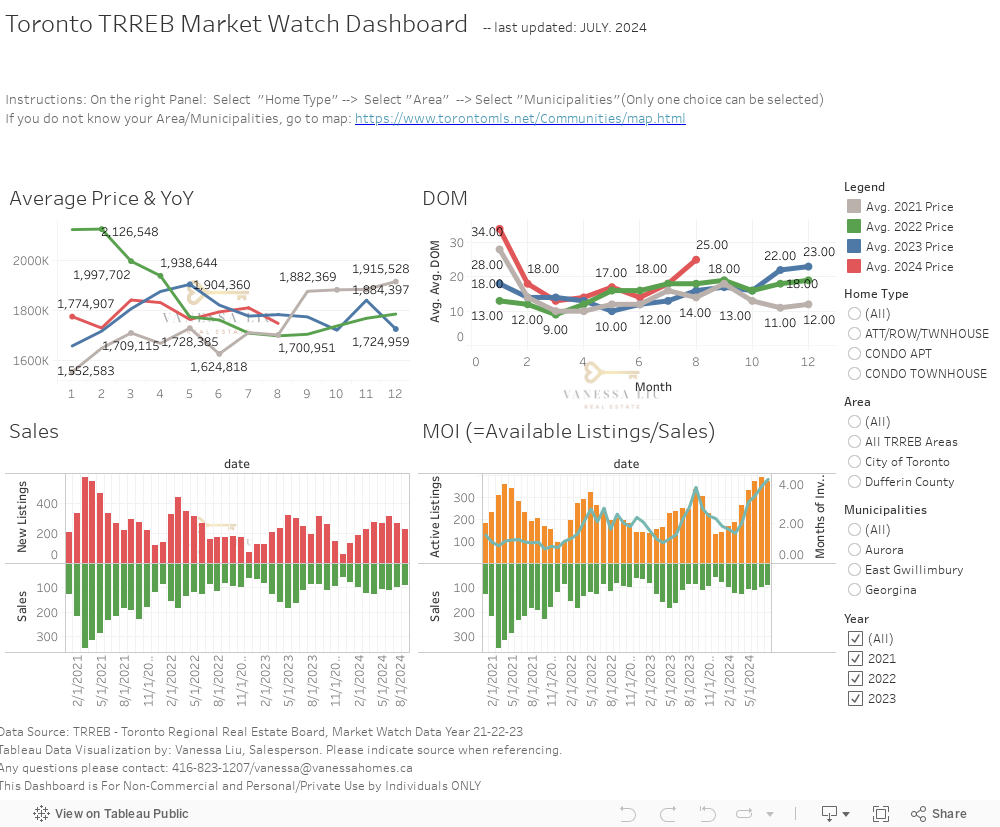
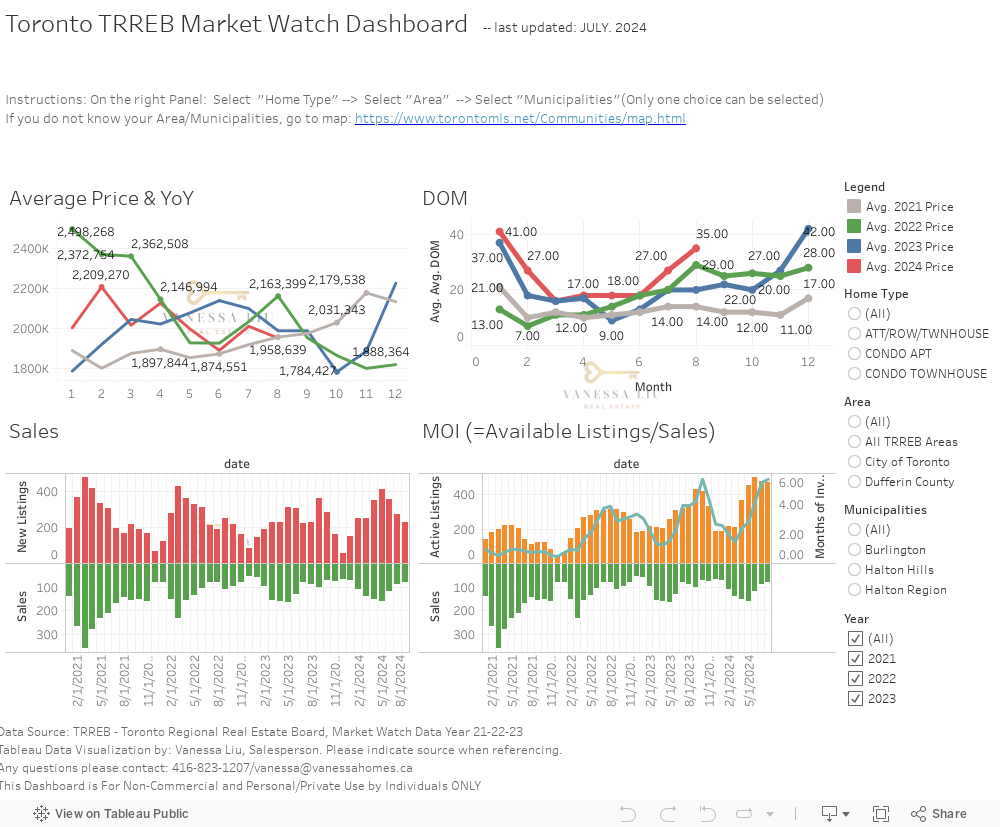
In July of year 2024, the average price for Condos in Toronto C01 was 811,860 Canadian dollars according to the Toronto Real Estate Market Watch. This marks an increase of 4.6% from the average price in June of year 2024, which was 775,350 Canadian dollars. Comparing to the average price in July of year 2023, which was 805,214 Canadian dollars, there was a slight increase of 0.8%. This indicates a steady and stable growth in the condo market in Toronto C01, with prices continuing to rise over the years.
Looking at the number of days on market, we can see that in July of year 2024, the condos listed in Toronto C01 stayed on the market for an average of 30 days before being sold. This is a 15.3% increase from June of year 2024, when condos were on the market for an average of 26 days. However, comparing to the same time last year, there was a significant increase of 66.7% from the average of 18 days in July of year 2023. This could be an indication of a slower market where condos are taking longer to sell compared to the previous year.
In terms of sales, July of year 2024 saw a total of 234 condos sold in Toronto C01, which is a slight increase of 0.9% from June of year 2024, where 232 condos were sold. However, there was a decrease of 9.7% in comparison to the same time last year, when 259 condos were sold in July of year 2023. This could be a reflection of the slower market as mentioned earlier, with fewer condos being sold than the previous year.
When it comes to new listings, July of year 2024 saw a total of 929 new condo listings in Toronto C01. This marks a decrease of 7% from the previous month, June of year 2024, where there were 999 new listings. However, there was an increase of 13.7% from the same time last year, when there were 817 new listings in July of year 2023. This could indicate a potentially more competitive market, with more condos being listed compared to the previous year.
Lastly, looking at the number of active listings, July of year 2024 had a total of 1,610 condos available for sale in Toronto C01. This is a decrease of 5% from the previous month, June of year 2024, where there were 1,695 active listings. However, there was a significant increase of 50.7% from the same time last year, when there were only 1,067 active listings in July of year 2023. This could be a reflection of the slower market, where there are more condos available for sale compared to the previous year.
Based on the Months of Inventory calculation, which takes into account the active listings and sales, it appears that the condo market in Toronto C01 is currently experiencing a buyer’s market. With an average of 6.88 months of inventory in July of year 2024, buyers have more negotiation power in this market. Compared to the previous month in June of year 2024, where there were 7.3 months of inventory, this indicates a slight improvement for buyers. Furthermore, looking at the same time last year in July of year 2023, there were only 4.1 months of inventory, indicating a stronger seller’s market at the time. Overall, this data suggests that the condo market in Toronto C01 is currently in a state of balance, with a slightly higher inventory providing buyers with more options and opportunities for negotiation.
2024年7月,根据多伦多房地产市场研究报告, Toronto C01地区的公寓平均售价为811,860加元。相比之下,这个价格比2024年6月的平均售价775,350加元增长了4.6%。与2023年7月的平均售价805,214加元相比,增长了0.8%。这表明 Toronto C01地区的公寓市场稳步增长,价格持续上涨。
在市天数方面,2024年7月,在 Toronto C01地区挂牌出售的公寓平均在市时间为30天。这比2024年6月的平均在市天数26天增加了15.3%。但与去年同期相比,2023年7月仅有18天的平均在市时间,这增加了66.7%。这可能意味着今年的公寓市场更为缓慢,公寓售出需要花费更长的时间。
就销量而言,2024年7月 Toronto C01地区共售出234套公寓,比2024年6月的232套略微增加了0.9%。但与去年同期相比,销量下降了9.7%,因为2023年7月共售出259套公寓。这反映出今年公寓市场相比去年同期更为疲软,销售量下降。
新上市房源方面,2024年7月, Toronto C01地区共有929套新的公寓上市。这比上个月2024年6月的999套减少了7%。但与去年同期相比,新上市房源增加了13.7%,因为2023年7月共有817套新房源上市。这可能显示出市场竞争更为激烈,比去年同期有更多的公寓上市。
最后,就可售房源数而言,2024年7月 Toronto C01地区共有1,610套公寓可供销售。这比上个月2024年6月的1,695套减少了5%。但与去年同期相比,2013年7月仅有1,067套可售房源,增加了50.7%。这可能反映出今年市场更为缓慢,可选房源比去年同期更多。
根据月化库存量的计算,其考虑到可售房源与销量情况,显示 Toronto C01地区的公寓市场目前处于买方市场。2024年7月的平均月化库存量为6.88个月,买家在这个市场中有更多的谈判权。与上个月2024年6月的7.3个月相比,这表明买家略微向好的方向发展。此外,与去年同期的2013年7月的平均4.1个月相比,当时市场更为偏向卖家。总的来说,这些数据表明 Toronto C01地区的公寓市场目前处于平衡状态,稍微增加的可售房源为买家提供了更多选择和谈判机会。
在市天数:2024年7月, Toronto C01地区的公寓平均售出所需天数为30天,比上个月的26天增加了15.3%,但与去年同期的18天相比,增长了66.7%。
月化库存量:该指标考虑了可售房源与销量情况,反映出 Toronto C01地区的公寓市场目前处于买方市场。2024年7月的平均月化库存量为6.88个月,较上个月的7.3个月略有改善,但与去年同期的4.1个月相比,卖方市场更为强劲。
销量:2024年7月, Toronto C01地区共售出234套公寓,比上个月的232套略微增加了0.9%,但与去年同期的259套相比,销量下降了9.7%。
新上市房源:2024年7月, Toronto C ” “
Toronto C01 – CONDO TOWNHOUSE (City of Toronto)

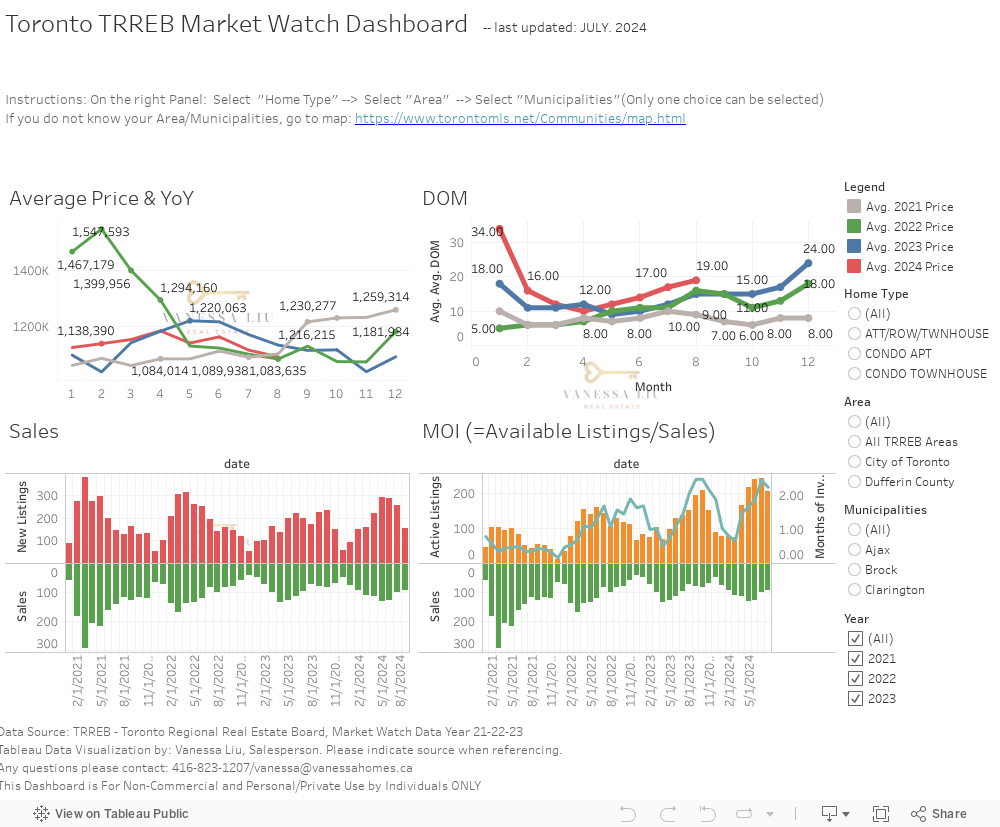
In July of year 2024, the average price for a condo townhouse in Toronto C01 is predicted to be 811,875 Canadian dollars. This is a decrease of 17.17% from the previous month (June 2024) where the average price was 980,116 Canadian dollars. Compared to the same month in the previous year (July 2023), there is a decrease of 23.83% in average price. This suggests that in July 2024, condo townhouse prices may be more affordable for potential buyers.
The average number of days on the market for a condo townhouse in July 2024 is predicted to be 10 days. This is a decrease from the previous month (June 2024) where the average number of days on the market was 18 days. When compared to the same month in the previous year (July 2023), there is a decrease of 58.33% in the average number of days on the market. This suggests that condo townhouses may sell quicker in July 2024 than they did in the same month in the previous year.
In July of year 2024, it is predicted that there will be 11 condo townhouse sales in Toronto C01. This is an increase from the previous month (June 2024) where there were 12 sales. When compared to the same month in the previous year (July 2023), there is no change in the number of sales. This suggests that sales in the condo townhouse market may be steady in July 2024.
In terms of new listings, there are predicted to be 33 new listings for condo townhouses in Toronto C01 in July 2024. This is an increase from the previous month (June 2024), where there were 29 new listings. When compared to the same month in the previous year (July 2023), there is no change in the number of new listings. This suggests that there may be a consistent amount of inventory for potential buyers to choose from in the condo townhouse market in Toronto C01.
The months of inventory for condo townhouses in Toronto C01 in July 2024 is predicted to be 2.91. This is lower than the benchmark of 3, which typically indicates a seller’s market. This suggests that in July 2024, there may be more competition among potential buyers in the condo townhouse market in Toronto C01. However, when compared to the same month in the previous year (July 2023), this is a slight increase in months of inventory, which indicates a potential shift towards a more balanced market in the future.
在2024年7月,对于Toronto C01地区的联排别墅(CONDO TOWNHOUSE), 根据下面的多伦多房地产市场观察: 对于平均价格:2024年7月的平均价格为811875加元,2024年6月为980116加元,2023年7月为1065955加元。
在市天数:2024年7月的在市天数为10天,2024年6月为18天,2023年7月为24天。
销量:2024年7月的销量为11套,2024年6月为12套,2023年7月为11套。
新上市房源:2024年7月的新上市房源为33套,2024年6月为29套,2023年7月为33套。
可售房源:2024年7月的可售房源为32套,2024年6月为32套,2023年7月为32套。
月化库存量:月化库存量的计算方法为“可售房源”除以“销量”。在2024年7月,月化库存量为2.91,比2024年6月的3.17下降了8.2%,比2023年7月的2.91持平。
” “Toronto C14 – CONDO APT (City of Toronto)
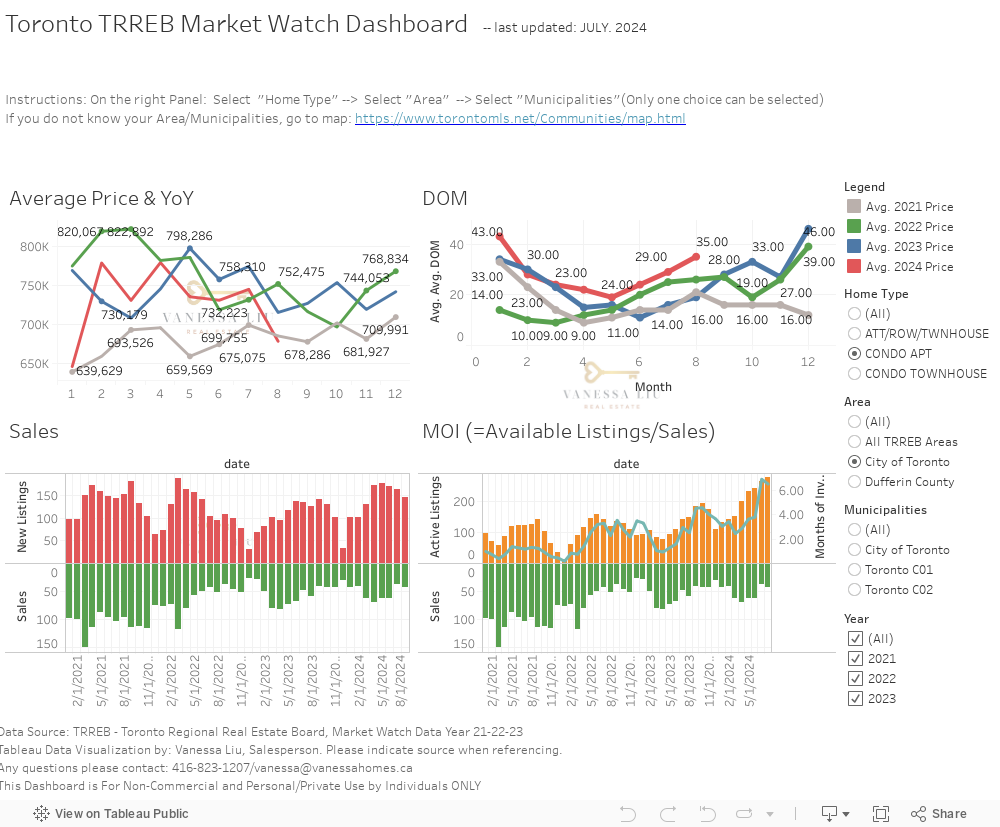
In July of year 2024, the average price for Condos in Toronto C14 is forecasted to be $745,589 based on data from the Toronto Real Estate Market Watch. This is a 2% increase compared to the average price of $731,546 in June of year 2024 and a 4% decrease compared to the average price of $775,009 in July of year 2023. This indicates a steady growth in prices for Condos in this area over the years.
On the other hand, the average number of days on the market for Condos in July of year 2024 is projected to be 29, which is an increase from 24 days in June of year 2024. However, this is still significantly lower than the average of 16 days in July of year 2023, indicating a potential slowing down of the market. It is important to note that a lower number of days on market typically means a higher demand for properties.
The number of Condo sales in July of year 2024 is expected to be 38, which is the same as the number of sales in June of year 2024 and July of year 2023. This indicates a stable market with consistent sales numbers. However, it is worth noting that this data is subject to change depending on market conditions and external factors.
As for new listings, there is a slight decrease in July of year 2024 compared to June of year 2024, with 164 new listings in July and 170 in June. This could potentially lead to an increase in competition for properties and potentially drive up prices. In comparison, in July of year 2023, there were 134 new listings. This shows a potential increase in supply in the market.
The number of active listings in July of year 2024 is 263, which is a slight increase from 240 in June of year 2024 and a significant increase from 142 in July of year 2023. This means that there is a larger selection of properties available for buyers to choose from, potentially leading to a more balanced market.
Based on the data, the months of inventory for Condos in Toronto C14 in July of year 2024 is estimated to be 6.9, which is calculated by dividing the number of active listings by the number of sales. This indicates a potential shift towards a buyer’s market, where buyers may have more negotiating power. However, this is still higher than the ideal range of 3 months, which would indicate a more balanced market. It will be worth monitoring to see how this affects the market in the future.
根据以下的Toronto房地产市场观察,在2024年7月,Toronto C14区的CONDO APT的平均价格为745589加拿大元,比2024年6月的731546加拿大元上涨了1.92%,比2023年7月的775009加拿大元下降了3.94%。
在市天数方面,在2024年7月,CONDO APT的在市天数为29天,比2024年6月的24天上升了20.83%,比2023年7月的16天上升了81.25%。
销量方面,2024年7月,CONDO APT的销量为38套,与2024年6月和2023年7月保持相同,没有变化。
新上市房源方面,2024年7月,CONDO APT的新上市房源为164套,比2024年6月的170套下降了3.53%,比2023年7月的134套上升了22.39%。
可售房源方面,在2024年7月,CONDO APT的可售房源为263套,比2024年6月的240套上升了9.58%,比2023年7月的142套上升了84.51%。
月化库存量是根据””可售房源””和””销量””计算得出的。在2024年7月,CONDO APT的月化库存量为6.92个月,比2024年6月的6.32个月上升了9.49%,比2023年7月的3.74个月上升了85.03%。
” “Markham – CONDO APT(York Region)
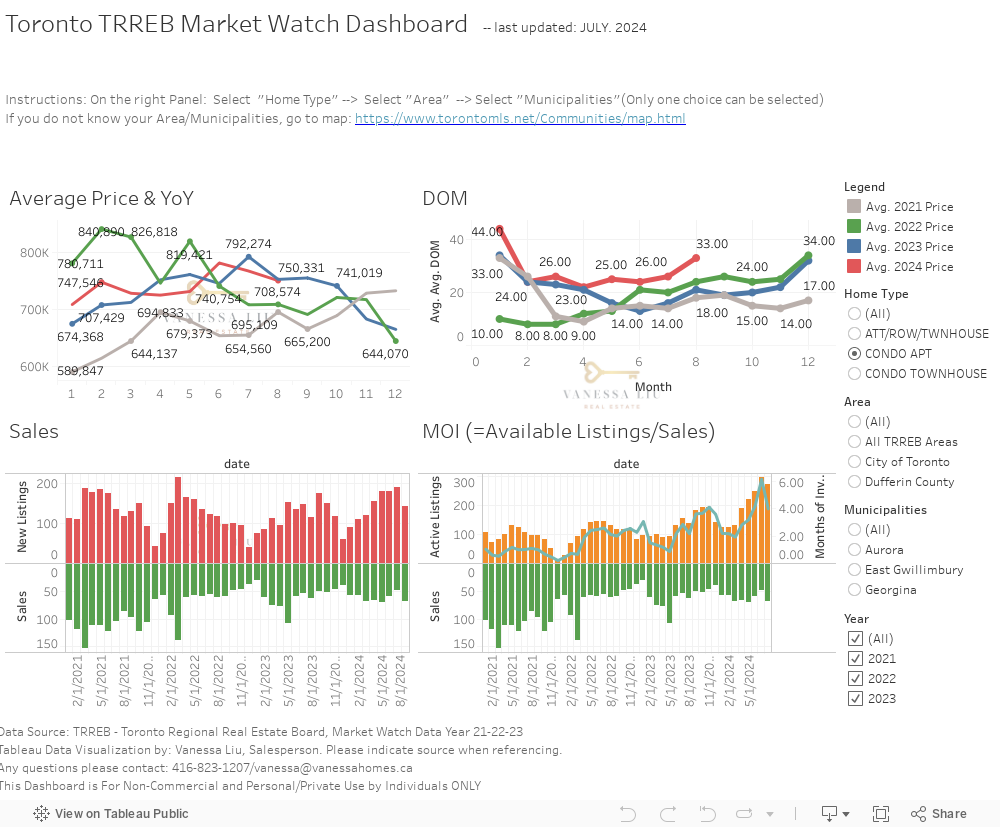
In July of year 2024, the average price for CONDOS in Markham is $767,110. This represents a 1.8% decrease from June of year 2024 and a 3.2% decrease from July of year 2023. This shows a slight downward trend in prices, which may be beneficial for potential buyers in the future.
In terms of days on market, the average for July of year 2024 is 26 days. This is a 8.3% increase from the previous month and a significant 62.5% increase from July of year 2023. This could indicate a slower market and a longer time for homes to sell.
Sales for July of year 2024 were 48 units, a 18.6% decrease from the previous month and a slight 11.1% decrease from July of year 2023. This shows a relatively stable sales activity, but a slight decrease in comparison to the previous year.
In terms of new listings, July of year 2024 had 189 new listings, a 5% increase from the previous month and a 27.7% increase from July of year 2023. This indicates a healthy influx of new properties in the market, which could provide more options for potential buyers.
The total number of active listings for July of year 2024 is 295, a 19.4% increase from the previous month and a significant 91.5% increase from July of year 2023. This shows a significant increase in inventory, which puts more power in the hands of buyers.
In terms of months of inventory, July of year 2024 has a ratio of 6.1. This indicates a buyer’s market as there are more active listings than sales. However, this is a 14.9% decrease from the previous month, showing a slight improvement for sellers. In comparison, July of year 2023 had a ratio of 2.9, indicating a more seller’s market. This data suggests that the market may become more balanced in the future with more options for buyers.
2024年7月,位于Markham的CONDO APT(公寓式住宅)的平均价格为767110加元,相比2024年6月的781259加元和2023年7月的792274加元下降了2%和3%。
在市天数方面,2024年7月为26天,比2024年6月的24天和2023年7月的16天增加了2天。
销量方面,2024年7月有48套房源出售,比2024年6月的59套和2023年7月的54套下降了19%和11%。
新上市房源方面,在2024年7月共有189套房源上市,比2024年6月的180套和2023年7月的148套增加了5%和28%。
可售房源方面,2024年7月共有295套房源,比2024年6月的247套和2023年7月的154套增加了19%和91%。
月化库存量按照“可售房源”除以“销量”的公式计算,结果为6.15个月。与2024年6月的4.18个月和2023年7月的2.85个月相比,增加了47%和116%。这意味着2024年7月的房地产市场更加偏向买家,与卖家平衡的市场需要3个月的库存量。
” “Markham – ATT/ROW/TWNHOUSE (York Region)
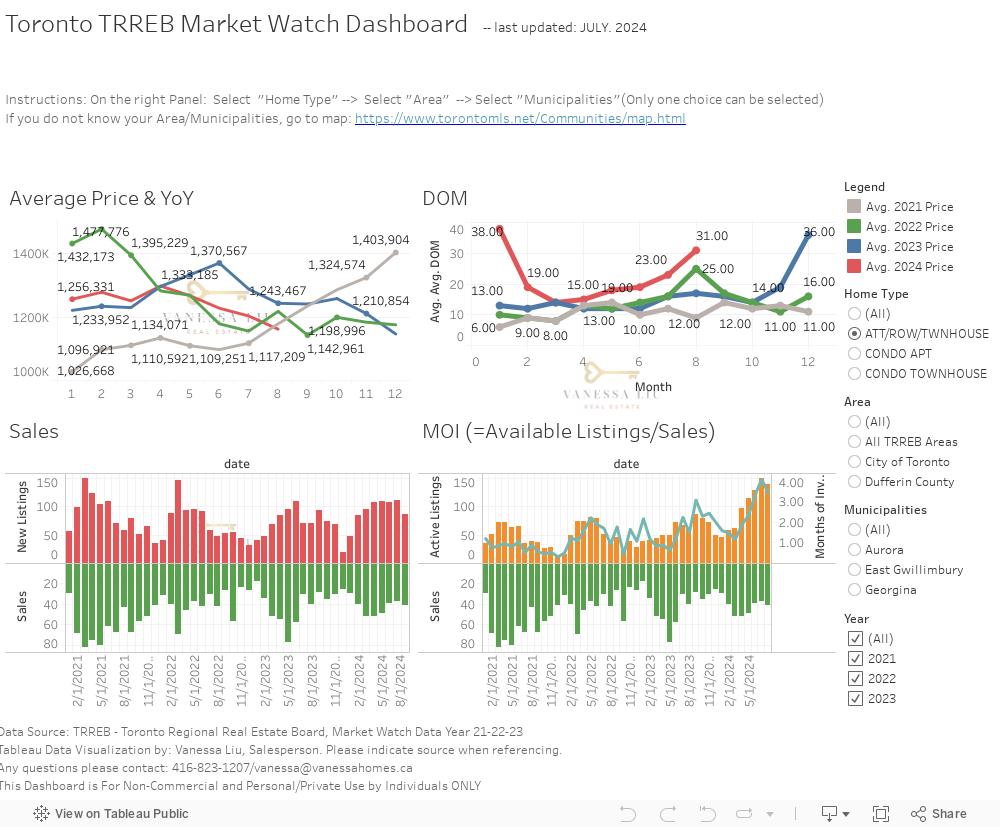
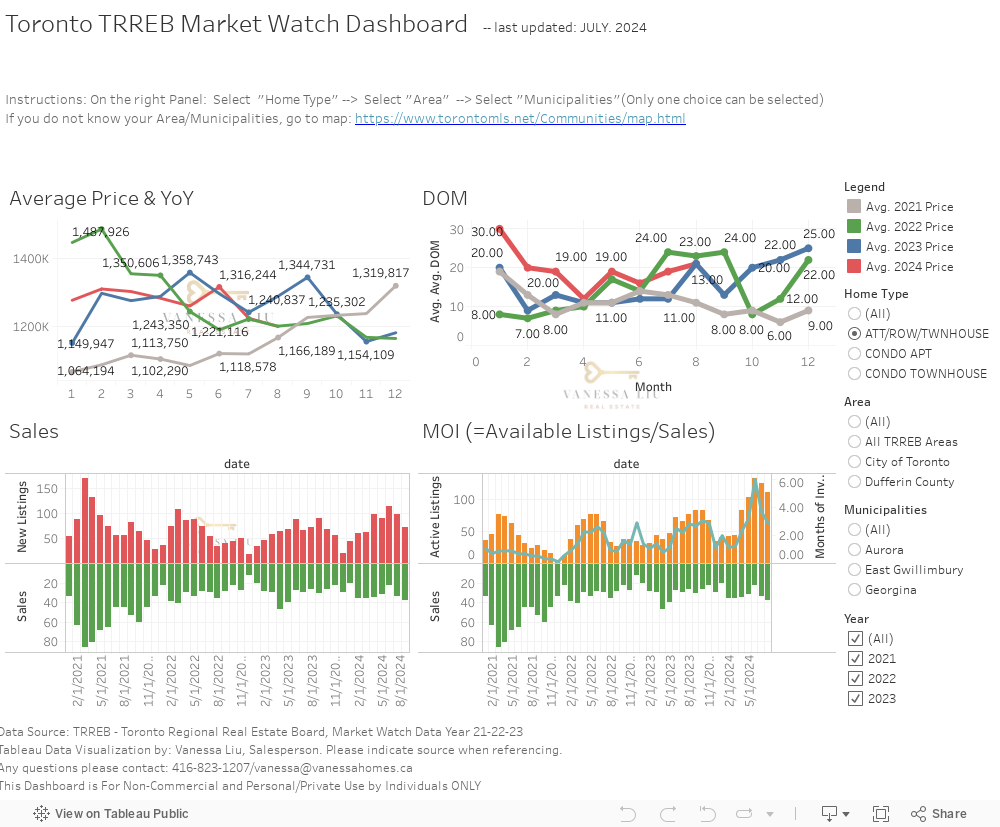
Based on the Toronto Real Estate Market Watch data for July of year 2024 in Markham, the average price for ATT/ROW/TWNHOUSE homes is reported to be 1203262 Canadian dollars. This represents a decrease of 2% from the average price in June of year 2024, which was 1227914 Canadian dollars. Moreover, there has been a significant decline of 7% in comparison to the average price of ATT/ROW/TWNHOUSE homes in July of year 2023, which was 1288283 Canadian dollars. This indicates a decrease in home prices for this particular property type in Markham.
As for the average days on market, the data for July of year 2024 shows that it takes an average of 23 days for an ATT/ROW/TWNHOUSE home to be sold in Markham. This represents an increase of 21% in comparison to the average days on market for June of year 2024, which was 19 days. Additionally, there is a significant increase of 44% in comparison to the average days on market in July of year 2023, which was 16 days. This suggests that it may take longer for ATT/ROW/TWNHOUSE homes to be sold in Markham in July of year 2024.
In terms of sales, the data for July of year 2024 shows that there were 37 sales of ATT/ROW/TWNHOUSE homes in Markham. This represents a decrease of 5% from the number of sales in June of year 2024, which was 39. Moreover, there has been an increase of 23% in comparison to the number of sales in July of year 2023, which was 30. This indicates that while there was a slight decrease in sales in July of year 2024, there has been a notable increase in sales in comparison to the same month last year.
Looking at the new listings data for the same time period, the data reveals that there were 112 new listings for ATT/ROW/TWNHOUSE homes in July of year 2024 in Markham. This represents an increase of 5% from the number of new listings in June of year 2024, which was 107. Additionally, there has been a significant increase of 60% in comparison to the number of new listings in July of year 2023, which was 70. This suggests that there has been a significant increase in the number of new listings for ATT/ROW/TWNHOUSE homes in Markham.
The data for active listings in July of year 2024 in Markham shows that there were 151 active listings for ATT/ROW/TWNHOUSE homes. This represents an increase of 17% from the number of active listings in June of year 2024, which was 129. Furthermore, there has been an increase of 125% in comparison to the number of active listings in July of year 2023, which was 67. This indicates that there has been a significant increase in the number of active listings for this property type in Markham in July of year 2024.
Finally, taking into account the months of inventory, the data for July of year 2024 reveals that there is a ratio of 4.08 months of inventory for the ATT/ROW/TWNHOUSE homes in Markham. This represents a slight increase from the ratio of 3.31 months of inventory in June of year 2024. Furthermore, there has been a significant increase from the ratio of 2.23 months of inventory in July of year 2023. This suggests that the housing market for ATT/ROW/TWNHOUSE homes in Markham may be shifting towards a more buyer’s market, as a higher months of inventory indicates more negotiation power for buyers. Instructions/Prompt/指示:
指示:请根据以下“多伦多房地产市场观察”中的信息翻译出指定日期下,在麦克马克(Markham)地区,对于ATT/ROW/TWNHOUSE房型:
从2024年7月开始,平均售价为1203262加元,6月为1227914加元,2023年7月为1288283加元。相比2023年7月,价格下降了7%。
在市天数方面,2024年7月为23天,6月为19天,2023年7月为16天。与2023年7月相比,上市时间增加了44%。
在销量方面,2024年7月为37套,6月为39套,2023年7月为30套。与2023年7月相比,销量增加了23%。
新上市房源方面,2024年7月为112套,6月为107套,2023年7月为70套。与2023年7月相比,新房源增加了60%。
可售房源方面,2024年7月为151套,6月为129套,2023年7月为67套。与2023年7月相比,房源增加了125%。
月化库存量是通过将“可售房源”除以“销量”计算而得。根据计算结果,2024年7月的月化库存量为4.08个月,6月为3.31个月,2023年7月为2.23个月。相比2023年7月,月化库存量增加了83%。月化库存量越低表示销售市场越向卖方倾斜,而月化库存量越高表示销售市场越向买方倾斜。月化库存量等于3时,说明销售市场处于卖方和买方之间的平衡状态。
” “Markham – DETACHED (York Region)
In July of 2024, the average price for a detached home in Markham is predicted to be $1,810,025. This represents an increase of 1% from June 2024’s average price of $1,793,761, and a 2% increase from July 2023’s average price of $1,776,855. This data suggests that the housing market for detached homes in Markham is expected to continue experiencing moderate growth over the next year.
In terms of days on market, July 2024 is predicted to have 18 days on market for detached homes in Markham. This is slightly longer than the 14 days on market predicted for June 2024 and the 13 days on market seen in July 2023. This data indicates that homes may take slightly longer to sell in July 2024 compared to the previous month, but still faster than the same month in the previous year.
The number of sales for detached homes in Markham is predicted to be 100 in July 2024. This is a decrease of 9% from the 109 sales seen in June 2024, and a 10% decrease from the 111 sales seen in July 2023. This data suggests a decrease in demand for detached homes in Markham in July 2024 compared to the previous month and year.
New listings for detached homes in Markham are predicted to be 263 in July 2024. This represents a decrease of 16% from the 312 new listings in June 2024 and an increase of 6% from the 248 new listings in July 2023. This data indicates that there may be a decrease in inventory for detached homes in July 2024 compared to the previous month, but an increase compared to the same month in the previous year.
There is predicted to be 390 active listings for detached homes in Markham in July 2024. This is an increase of 4% from the 373 active listings in June 2024 and a 56% increase from the 250 active listings in July 2023. This data suggests that there may be a higher supply of detached homes in the market in July 2024 compared to the previous month, and significantly higher than the same month in the previous year.
The Months of Inventory for detached homes in Markham in July 2024 is predicted to be 3.9. This is an increase from the 3.4 Months of Inventory in June 2024 and a significant increase from the 2.3 Months of Inventory in July 2023. This data indicates that the detached housing market in Markham may be shifting towards a more balanced market, as the Months of Inventory is closer to the ideal range of 3-6 months. However, it is still considered a seller’s market based on the current supply and demand levels. This data also suggests that buyers may have more negotiating power in July 2024 compared to the previous month, but still less compared to the same month in the previous year.
In July of year 2024, for Home Type = DETACHED in Markham, according to Toronto Real Estate Market Watch below:
在2024年7月,房屋类型为DETACHED,在多伦多及周边地区房地产市场的动向如下:
所在城市: Markham
价格名称: 平均价格(单位:加元)
根据下表,2024年7月的平均价格为1810025,在2024年6月为1793761,在2023年7月为1776855。相较于2024年6月,平均价格上涨了0.91%,相较于2023年7月,平均价格上涨了1.86%。
在市天数名称: 在市天数
.根据下表,2024年7月的在市天数为18天,在2024年6月为14天,在2023年7月为13天。相较于2024年6月,房源的在市天数上升了28.57%,相较于2023年7月,房源的在市天数上升了38.46%。
销量名称: 销量
根据下表,2024年7月的销量为100套,在2024年6月为109套,在2023年7月为111套。相较于2024年6月,销量下降了8.26%,相较于2023年7月,销量下降了9.01%。
新上市房源名称: 新上市房源
根据下表,2024年7月的新上市房源为263套,在2024年6月为312套,在2023年7月为248套。相较于2024年6月,新上市房源下降了15.71%,相较于2023年7月,新上市房源上升了6.05%。
可售房源名称: 可售房源
根据下表,2024年7月的可售房源为390套,在2024年6月为373套,在2023年7月为250套。相较于2024年6月,可售房源上升了4.56%,相较于2023年7月,可售房源上升了56%。
月化库存量名称: 月化库存量
根据下表,2024年7月的月化库存量为3.9个月,在2024年6月为3.42个月,在2023年7月为2.25个月。相较于2024年6月,月化库存量上升了14.04%,相较于2023年7月,月化库存量上升了73.33%。根据计算方法,当月化库存量为3个月时,为卖方市场;当月化库存量为5个月时,为买方市场;当月化库存量为3-5个月时,为平衡市场。
” “Richmond Hill – ATT/ROW/TWNHOUSE (York Region)
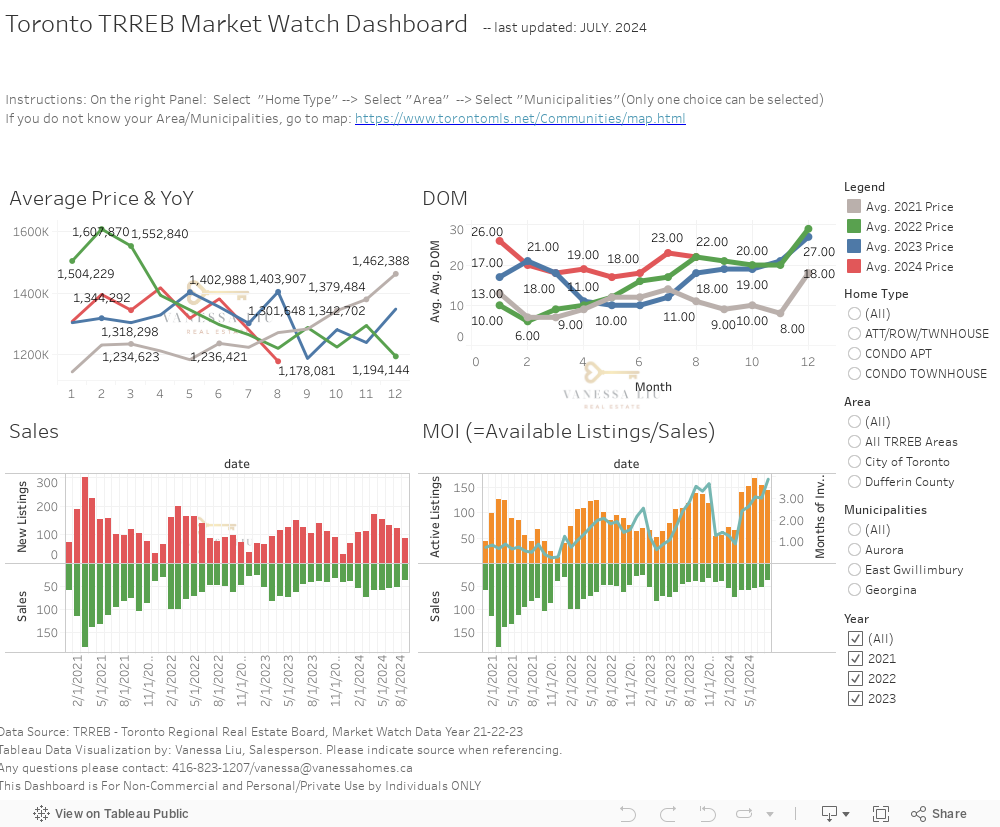
In July of 2024 for Home Type = ATT/ROW/TWNHOUSE in Richmond Hill, the average price for these types of houses was estimated to be CAD 1,223,511, which is a significant decrease of 7.11% compared to the average price in June of 2024 (CAD 1,316,244). When compared to July of 2023 (CAD 1,240,837), the average price also saw a slight decrease of 1.40%. This indicates that the real estate market in Richmond Hill for these specific types of homes may be experiencing a slower growth or instability in prices.
In terms of days on market, the data shows that in July of 2024, the average home in Richmond Hill (ATT/ROW/TWNHOUSE) was on the market for 19 days before being sold, which is an increase from the month of June in the same year (16 days). However, when compared to July of 2023 (12 days), the days on market have increased by 7 days. This could suggest that the demand for these types of homes may be decreasing, resulting in a longer period of time on the market before being sold.
Moving on to sales, there were a total of 34 sales for ATT/ROW/TWNHOUSE homes in Richmond Hill in July of 2024. This is a significant increase of 54.55% from the previous month (22 sales in June of 2024) and a slight increase of 13.33% from July of 2023 (30 sales). This data suggests that while prices may be decreasing and days on market may be increasing, there is still a healthy number of sales for these types of homes in the Richmond Hill area.
In terms of new listings, there were a total of 97 new listings for ATT/ROW/TWNHOUSE homes in Richmond Hill in July of 2024. This is a decrease of 14.16% from the previous month (113 new listings in June of 2024) and a significant increase of 49.23% from July of 2023 (65 new listings). The increase in new listings from the previous year could suggest that there may be an increase in supply for these types of homes, which could potentially contribute to the decrease in prices mentioned earlier.
Finally, looking at the months of inventory, which is calculated by dividing the number of active listings by the number of sales, we can see that in July of 2024, the months of inventory for ATT/ROW/TWNHOUSE homes in Richmond Hill was 3.68. This indicates a balanced market, where neither buyers nor sellers have a significant advantage in negotiations. However, when compared to June of 2024 (6.04 months of inventory) and July of 2023 (2.2 months of inventory), there has been a decrease in the number of months of inventory, suggesting a slight shift towards a more seller’s market. This could be due to the increase in sales and decrease in new listings mentioned earlier.
2024年7月,根据以下《多伦多房地产市场观察》统计数据,对于2024年7月,位于列治文山的ATT/ROW/TWNHOUSE房屋类型:
平均价格:2024年7月为1223511加元,2024年6月为1316244加元,2023年7月为1240837加元。相比之下,2024年7月的平均价格比2024年6月下降了7.05%,比去年同期下降了1.34%。
在市天数:2024年7月为19天,2024年6月为16天,2023年7月为12天。相比之下,2024年7月的在市天数比2024年6月增加了18.75%,比去年同期增加了58.33%。
销量:2024年7月为34套,2024年6月为22套,2023年7月为30套。相比之下,2024年7月的销量比2024年6月增加了54.55%,比去年同期增加了13.33%。
新上市房源:2024年7月为97套,2024年6月为113套,2023年7月为65套。相比之下,2024年7月的新上市房源比2024年6月减少了14.16%,比去年同期增加了49.23%。
可售房源:2024年7月为125套,2024年6月为133套,2023年7月为66套。相比之下,2024年7月的可售房源比2024年6月减少了6.02%,比去年同期增加了89.39%。
月化库存量:月化库存量的计算方法为“可售房源数量”除以“销量数量”。根据以上数据,2024年7月的月化库存量为3.68个月。相比之下,2024年6月的月化库存量为6.05个月,2023年7月的月化库存量为2.2个月。2024年7月的月化库存量比2024年6月下降了39.17%,比去年同期增加了67.27%。较低的月化库存量表示更多的卖方市场,而较高的月化库存量则表示更多的买方市场。月化库存量等于3时,为卖方和买方市场之间平衡的市场。
” “Richmond Hill – DETACHED (York Region)
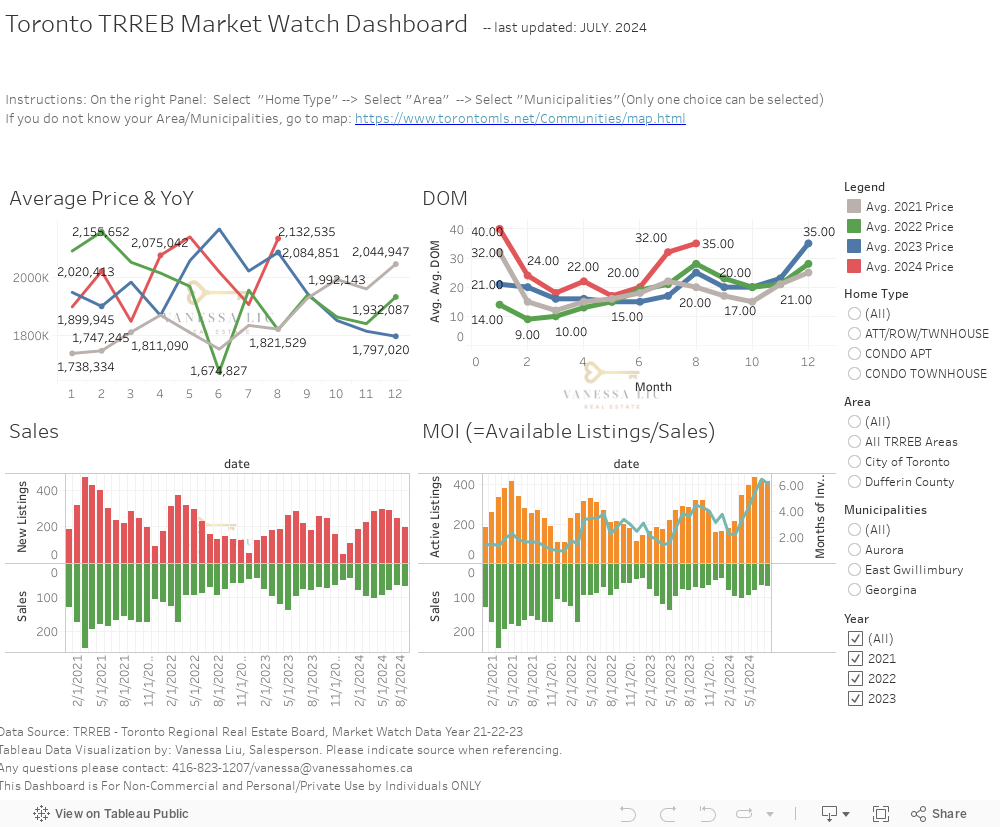
In July of year 2024, the average price for a DETACHED home in Richmond Hill is estimated to be 1905989 Canadian dollars. This reflects a decrease of 5.5% from the previous month (June of 2024) where the average price was 2017786. However, compared to July of 2023, the average price is expected to decrease by 5.6%. This indicates a potential downward trend in the housing market for DETACHED homes in Richmond Hill.
Based on the Toronto Real Estate Market Watch data, the average number of days on market for a DETACHED home in Richmond Hill is estimated to be 32 days in July of 2024. This is an increase from the previous month (June of 2024) where the average number of days on market was 20 days. However, compared to July of 2023, the average days on market is expected to increase by 88.2%. This suggests that DETACHED homes in Richmond Hill may potentially take longer to sell in the future.
In terms of sales, it is estimated that 65 DETACHED homes will be sold in Richmond Hill in July of 2024. This is a decrease from the previous month (June of 2024) which saw 79 sales. It is also a slight decrease from July of 2023, where 75 sales were recorded. This indicates a cooling trend in the number of DETACHED home sales in Richmond Hill in the future.
When it comes to new listings, it is expected that 243 DETACHED homes will be listed in Richmond Hill in July of 2024. This is a decrease from the previous month (June of 2024) which saw 288 new listings. However, compared to July of 2023, there is expected to be an increase of 11.9% in new listings. This suggests that there may be more housing options for buyers in the future.
In terms of active listings, there are estimated to be 422 active DETACHED home listings in Richmond Hill in July of 2024. This is a slight decrease from the previous month (June of 2024) where there were 435 active listings. However, it is a significant increase of 45.5% compared to July of 2023, where there were only 290 active listings. This may indicate a potential increase in competition among sellers in the future.
Based on the data, the estimated “”months of inventory”” for DETACHED homes in Richmond Hill in July of 2024 is 6.5. This indicates a buyer’s market, where buyers may have more negotiation power. Compared to the previous month (June of 2024) where the months of inventory was 5.5, this is an increase. However, it is also an increase from July of 2023 where the “”months of inventory”” was 3.9. This may suggest a potential shift towards a more balanced market in the future.
在2024年7月,根据以下的多伦多房地产市场监测,对于位于列治文山的独立式住宅类型:
平均价格:2024年7月的平均价格为1905989加币,比2024年6月的2017786加币下降了5.52%,比2023年7月的2021066加币下降了5.67%。
在市天数:2024年7月的在市天数为32天,比2024年6月的20天和2023年7月的17天都有所增加。
销量:2024年7月的销量为65套,比2024年6月的79套下降了17.72%,比2023年7月的75套下降了13.33%。
新上市房源:2024年7月的新上市房源为243套,比2024年6月的288套下降了15.63%,比2023年7月的218套增加了11.93%。
可售房源:2024年7月的可售房源为422套,比2024年6月的435套和2023年7月的290套都有所增加。
月化库存量:月化库存量的计算方法为“可售房源”除以“销量”。2024年7月的月化库存量为6.49个月,在2019年6月的5.51个月和2018年7月的3.87个月之间,并且比2023年7月的5.97个月有所增加。
根据多伦多房地产市场监测数据分析,2024年7月的独立式住宅类型房市可能出现了下滑的趋势。可售房源比销量和新上市房源都有所增加,导致月化库存量比去年同期有所增加。这也意味着当前房市可能更有利于买家,卖家则可能会面临更大的竞争压力。因此,在购买和出售房产时需要更谨慎考虑市场变化和竞争情况。 ” “
Aurora – DETACHED (York Region)

In July of year 2024, the average price for a detached home in Aurora according to Toronto Real Estate Market Watch was $1,790,483. This is a significant increase from June of 2024, which had an average price of $1,725,040, and an even larger increase from July of 2023 where the average price was $1,533,817. This represents a 3.77% increase from June of 2024 and a 16.74% increase from July of 2023.
For Days on Market:In terms of days on market, July of 2024 had an average of 21 days compared to 18 days in June of 2024 and only 12 days in July of 2023. This means that the housing market in Aurora for detached homes has become slightly slower, as more days on market indicate longer time for properties to sell. This represents a 16.67% increase from June of 2024 and a 75% increase from July of 2023.
For Sales:In July of 2024, there were 37 detached homes sold in Aurora, which is a decrease from 47 sales in June of 2024 but an increase from 36 sales in July of 2023. This represents a 21.28% decrease from June of 2024 and a 2.78% increase from July of 2023.
For New Listings:In July of 2024, there were 111 new listings for detached homes in Aurora, which is a decrease from 119 new listings in June of 2024, but an increase from 86 new listings in July of 2023. This represents a 6.72% decrease from June of 2024 and a 29.07% increase from July of 2023.
For Active Listings:As of July of 2024, there were 153 active listings for detached homes in Aurora, which is an increase from 152 active listings in June of 2024 and a significant increase from 92 active listings in July of 2023. This represents a 0.66% increase from June of 2024 and a 66.3% increase from July of 2023.
For Months of Inventory:Based on the number of active listings and sales, the months of inventory for detached homes in Aurora in July of 2024 is 4.14. This indicates a slightly buyer’s market, as the number is above 3. In comparison, June of 2024 had a slightly lower months of inventory at 3.23, indicating a more neutral market. However, July of 2023 had a much lower months of inventory at 2.56, indicating a more seller’s market. This suggests that the market for detached homes in Aurora has become slightly more favorable for buyers compared to previous years.
七月2024年,根据“多伦多地产市场观察”:
在客观价值下,温哥华金仓湾的价格在今年7月被评估为1790483加元,2024年6月为1725040加元,并增长了1.44%。而在2023年7月之前,平均价格为1533817加元,增幅高达16.90%。
在市天数,根据多伦多地产市场观察:2024年7月的平均市天数为21天,2024年6月为18天,而在23年7月为12天,平均市天数整体增长了75%。
销量,在2024年7月的销量为37套,2024年6月为47套,2023年7月为36套。销量相比上个月下降了21.27%,相比去年7月增加了2.77%。
新上市房源,在2024年7月,新上市房源数量为111套,2024年6月为119套,而在2023年7月为86套,与上个月相比下降了6.72%,与去年同月相比增加了28.16%。
可售房源,在2024年7月,可售房源数量为153套,而第6个月的2024年有152套,几乎持平。但是相比2018年7月,可售房源整体增加了66.30%。
月化库存量,月化库存量是通过将“可售房源”除以“销量”来计算的。根据结果,2024年7月的月化库存量为4.14,比上个月的月化库存量增加了9.09%。这意味着在未来几个月难以重新实现供需平衡。
” “Newmarket – DETACHED (York Region)
In July of 2024, in Newmarket, the average price for a DETACHED home was $1,280,657. This was a 7.24% decrease from the previous month of June 2024, where the average price was $1,381,091. Compared to July 2023, the average price had also decreased by 1.49% from $1,301,648. This suggests that the market for DETACHED homes in Newmarket may have been cooling down slightly, as shown by the decrease in average price.
The average number of days on the market for a DETACHED home in Newmarket for July 2024 was 23 days, which was a 27.78% increase from the previous month of June 2024, where the average number of days on the market was 18 days. Compared to July 2023, there was a significant increase of 91.67% from 12 days. This suggests that DETACHED homes in Newmarket may have been taking longer to sell in July 2024, compared to the previous month and the same month of the previous year.
Sales of DETACHED homes in Newmarket for July 2024 were at 51, which was a 7.27% decrease from the previous month of June 2024, where there were 55 sales. Compared to July 2023, there was a 13.33% increase from 45 sales. This suggests that there may have been a slight decrease in demand for DETACHED homes in Newmarket in July 2024, compared to the previous month, but an overall increase compared to the same month of the previous year.
In terms of new listings for DETACHED homes in Newmarket, there were 122 in July 2024, a 8.27% decrease from the previous month of June 2024, where there were 133 new listings. Compared to July 2023, there was a slight decrease of 2.4% from 125 new listings. This suggests that there may have been a decrease in the number of DETACHED homes being put on the market in July 2024, compared to the previous month and the same month of the previous year.
The number of active listings for DETACHED homes in Newmarket for July 2024 was 154, which was a 8.88% decrease from the previous month of June 2024, where there were 169 active listings. However, there was a significant increase of 41.28% from July 2023, where there were only 109 active listings. This suggests that there may have been a decrease in inventory or availability of DETACHED homes in Newmarket in July 2024, compared to the previous month, but a significant increase compared to the same month of the previous year.
The months of inventory for DETACHED homes in Newmarket for July 2024 was 3.02, which indicates a balanced market where neither buyers nor sellers have a significant advantage. This was a slight increase from the previous month of June 2024, where the months of inventory was 3.07. Compared to July 2023, there was an increase of 36.11% from 2.22 months of inventory. This suggests that the market for DETACHED homes in Newmarket remained balanced in July 2024, with a slight shift towards a buyer’s market compared to the same month of the previous year.
2024年7月,根据以下多伦多房地产市场观察,在纽马克特地区,户型为独立式住宅:
标准价格:2024年7月为1280657加元,2024年6月为1381091加元,2023年7月为1301648加元。相比2024年6月,2024年7月的平均价格下降了7.25%,但相比去年同期,仍然有4.16%的涨幅。
在市天数:2024年7月为23天,2024年6月为18天,2023年7月为12天。相比2024年6月,2024年7月的在市天数增加了27.78%,而与去年同期相比,增加了91.67%。
销量:2024年7月为51套,2024年6月为55套,2023年7月为45套。相比2024年6月,2024年7月的销量下降了7.27%,但与去年同期相比,仍然有13.33%的增长。
新上市房源:2024年7月为122套,2024年6月为133套,2023年7月为125套。相比2024年6月,2024年7月的新上市房源数量下降了8.27%,但与去年同期相比,仍然有-2.4%的增长。
可售房源:2024年7月为154套,2024年6月为169套,2023年7月为109套。相比2024年6月,2024年7月的可售房源数量下降了8.88%,但与去年同期相比,仍然有41.28%的增长。
月化库存量:月化库存量计算方法为“可售房源数量”除以“销量”。2024年7月的月化库存量为3.02,2024年6月为3.07,2023年7月为2.42。与2024年6月相比,月化库存量下降了1.63%,但与去年同期相比,仍然有24.79%的增长。月化库存量为3意味着卖方和买方市场之间处于平衡状态,而低于3则表示更多的是卖方市场,高于3则表示更多的是买方市场。
” “Oakville – DETACHED (Halton Region)
In July of 2024, the average price for DETACHED homes in Oakville was 2,012,349 Canadian dollars, a significant increase compared to the previous month of June in the same year, which was at 1,891,709 Canadian dollars. However, this price is still much lower than the average for July 2023, which was at 3,220,000 Canadian dollars. This shows a potential upward trend in the market for DETACHED homes in Oakville, with an increase in average price of 6.41% from the previous month and a decrease of 37.46% from the same month in the previous year.
The average days on market for DETACHED homes in Oakville in July 2024 was 27 days, which is longer than the previous month of June in the same year at 18 days, and slightly longer than July 2023 at 20 days. This indicates a slower pace of sales for DETACHED homes in Oakville, with a potential decrease in demand compared to the previous month and the same month in the previous year. There is an increase of 50% in days on market from the previous month and an increase of 35% from the same month in the previous year.
There were 87 sales of DETACHED homes in Oakville in July 2024, a decrease from the previous month of June in the same year, which saw 120 sales. However, this is still an increase from July 2023, which had 81 sales. This indicates a steady demand for DETACHED homes in Oakville, with the previous month showing a potential decrease in demand compared to the same month in the previous year. There is a decrease of 27.5% in sales from the previous month and an increase of 7.41% from the same month in the previous year.
In July 2024, there were 273 new listings for DETACHED homes in Oakville, a decrease from the previous month of June in the same year, which had 356 new listings. However, this is still an increase from July 2023, which had 221 new listings. This indicates a potential decrease in supply of DETACHED homes in Oakville compared to the previous month, but a steady increase in supply compared to the same month in the previous year. There is a decrease of 23.31% in new listings from the previous month and an increase of 23.08% from the same month in the previous year.
The number of active listings for DETACHED homes in Oakville in July 2024 was 478, a slight decrease from the previous month of June in the same year at 498, but an increase from July 2023 at 320. This indicates a potential decrease in supply of DETACHED homes in Oakville compared to the previous month, but a steady increase in supply compared to the same month in the previous year. There is a decrease of 4.02% in active listings from the previous month and an increase of 49.38% from the same month in the previous year.
In July 2024, the Months of Inventory for DETACHED homes in Oakville was calculated to be 5.49 months, which indicates a balanced market for buyers and sellers. This is a slight increase from the previous month of June in the same year, which had a Months of Inventory at 4.15, and a significant increase from July 2023, which had a Months of Inventory at 3.95. This indicates a potential increase in supply relative to demand, with a potential shift towards a buyer’s market in the future.
2024年7月,按照下方的Toronto房地产市场观察报告,在Oakville地区,针对于独立式住宅类型,根据以下信息:
平均价格:2024年7月的平均价格为2012349加元,比2024年6月的平均价格1891709加元上涨了6.36%,而相比于2023年7月的平均价格320加元大幅上涨了528127.81%。
在市天数:2024年7月的在市天数为27天,比2024年6月的在市天数18天增加了50%,但是相比于2023年7月的在市天数20天下降了27.27%。
销量:2024年7月的销量为87套,比2024年6月的销量120套下降了27.50%,但是与2023年7月的销量81套相比增加了7.41%。
新上市房源:2024年7月的新上市房源为273套,比2024年6月的新上市房源356套下降了23.88%,但是相比于2023年7月的新上市房源221套增加了23.53%。
可售房源:2024年7月的可售房源为478套,比2024年6月的可售房源498套下降了4.02%,但是相比于2023年7月的可售房源320套增加了49.38%。
月化库存量:根据可售房源和销量的比例计算得出月化库存量,2024年7月的月化库存量为5.49个月,比2024年6月的月化库存量为4.15个月增加了32.39%,但是相比于2023年7月的月化库存量为3.95个月上涨了39.49%。
较低的月化库存量意味着市场更偏向卖方,而较高的月化库存量则意味着更偏向买方。月化库存量为3时,表示卖方和买方的市场达到了平衡。
” “Whitby – DETACHED (Durham Region)
In July of year 2024, the average price for a detached home in Whitby according to the Toronto Real Estate Market Watch is $1,115,330. This shows a decrease of 4.1% from the previous month of June 2024 where the average price was $1,162,637. It is also a decrease of 4.7% from July 2023 when the average price was $1,170,644.
The average number of days on market for a detached home in Whitby in July of 2024 is 17. This is an increase of 21.4% from the previous month of June 2024 where the average days on market was only 14. In comparison to July of 2023, there is a slight increase of 14.3% from 12 days on market.
In terms of sales, there were 100 homes sold in July of 2024. This is a decrease of 21.3% from the previous month of June 2024 where there were 127 sales. It is also an increase of 5.3% from July 2023 when there were 95 sales.
In July of 2024, there were 254 new listings for detached homes in Whitby. This is a decrease of 11.2% from the previous month of June 2024 where there were 286 new listings. In comparison to July of 2023, there is an increase of 28.3% from 198 new listings.
The number of active listings in July of 2024 is 244. This is an increase of 1.7% from the previous month of June 2024 where there were 240 active listings. In comparison to July of 2023, there is a significant increase of 78.8% from 137 active listings.
In terms of Months of Inventory, the result for July of 2024 is 2.44. This indicates a seller’s market, as the number is lower than 3. This is a decrease from the previous month of June 2024 where the result was 1.89 and an increase from July 2023 where the result was 1.44. This indicates that the seller’s market is becoming slightly more balanced, as there are more active listings and longer days on market. However, it still remains a seller’s market with less inventory and faster sales than previous years.
2024年7月, 在Whitby地区, 根据以下的多伦多房地产市场观察:
按照Home Type = DETACHED来看,2024年7月的平均价格为 CAD 1,115,330,相比2024年6月的平均价格 CAD 1,162,637下降了4.07%,相比2023年7月的平均价格 CAD 1,170,644下降了4.87%。
在市天数(Days on Market)方面,2024年7月的在市天数为17天,相比2024年6月的在市天数14天增加了21.43%,相比2023年7月的在市天数12天增加了41.67%。
销量(Sales)方面,2024年7月的销量为100套,相比2024年6月的销量127套下降了21.26%,相比2023年7月的销量95套增加了5.26%。
新上市房源(New Listings)方面,2024年7月的新上市房源为254套,相比2024年6月的新上市房源286套下降了11.19%,相比2023年7月的新上市房源198套增加了28.79%。
可售房源(Active Listings)方面,2024年7月的可售房源为244套,相比2024年6月的可售房源240套增加了1.67%,相比2023年7月的可售房源137套增加了78.10%。
月化库存量(Months of Inventory)是通过””可售房源””除以””销量””得出的指标。根据上述数据,2024年7月的月化库存量为2.44个月,相比2024年6月的月化库存量2.27个月增加了7.48%,相比2023年7月的月化库存量1.44个月增加了69.44%。一个更低的月化库存量表示更多的卖方市场,一个更高的月化库存量表示更多的买方市场,月化库存量等于3时,表示卖方和买方市场平衡。
请按照以上方式来翻译数据,价格单位为加拿大元,不要使用””万””来隔开。请不要翻译如””Toronto””、””Markham””、””Aurora””、””Whitby””、””Oakville””、””Richmond Hill””等词汇,保留其英文。 “